The 02/23/26 blog “NYSE Composite Target Reached – 02/23/26” illustrated that the NYSE Composite had completed an Elliott wave – Ending Diagonal Triangle. The sharp decline on 02/23/26 appeared to be the start of a 10% multi-week drop. Stock bulls had other plans, and on 02/26/26 the NYSE Composite exceeded the peak made on 02/23/26 invalidating the presume Ending Diagonal Triangle wave count.
U.S. stocks could be in a multi-week rounding top.
The 30 – minute S&P 500 (SPX) chart courtesy of Trading View shows what’s been happening.
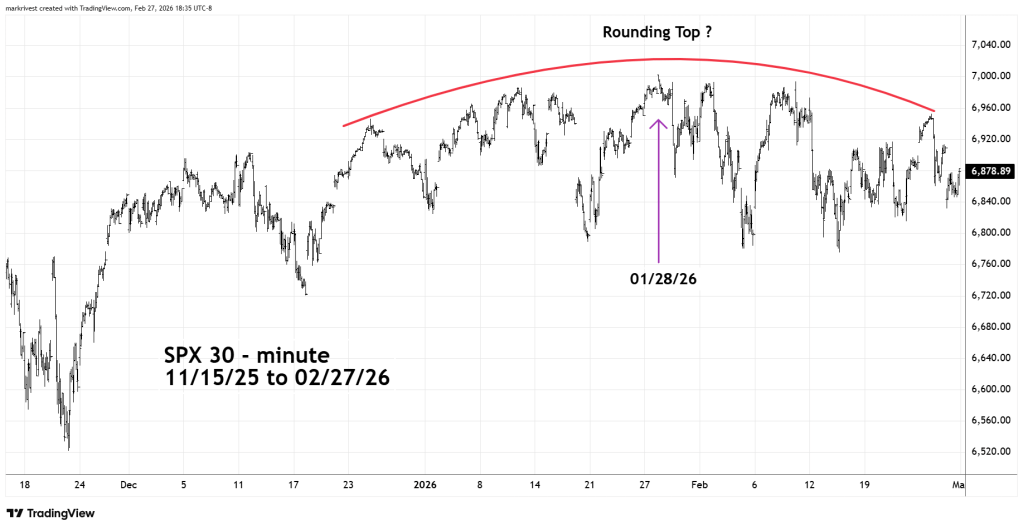
The narrow choppy range for the last several weeks could be a rounding top which may continue for days, possibly weeks.
On the bullish side of the coin the action could be a base prior to new all-time highs.
Very short – term Elliott wave analysis illustrates levels to watch.
The first five – minute SPX chart examines a short-term bullish scenario.
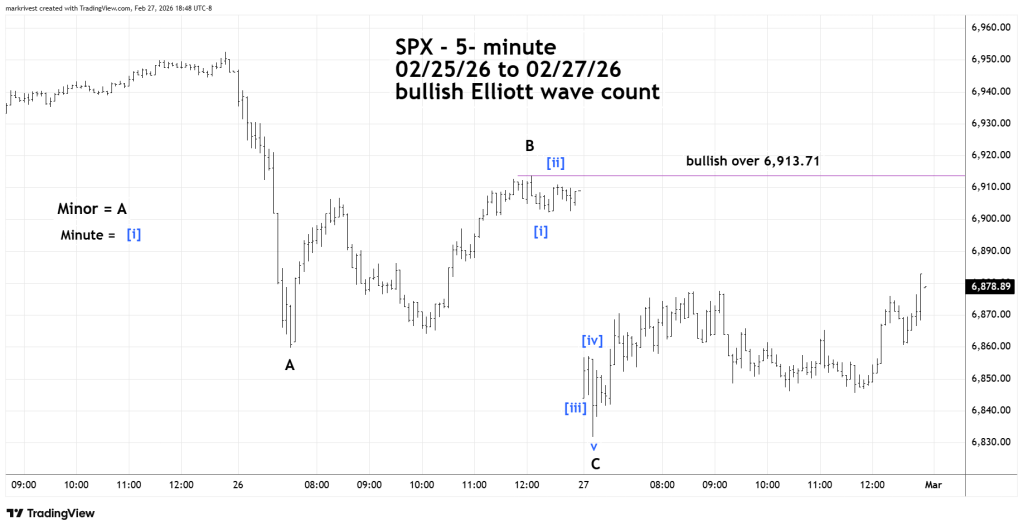
The move down from the 02/25/26 peak appears to be an Elliott wave – Single Zigzag. If so a move above the presumed Minor wave “B” top at 6,913.71 could open the door for a rally back to the 02/25/26 peak. A move above the high made on 02/25/26 could open the door for a rally back to the all-time high made on 01/28/26.
The next SPX five – minute chart illustrates a bearish scenario.
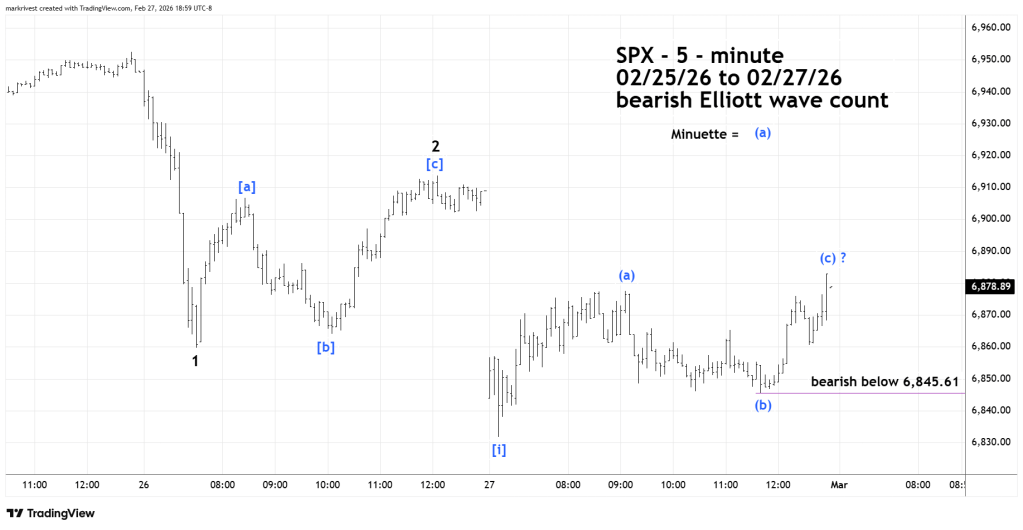
The move down from the 02/25/26 high could be a bearish series of wave “one’s and two’s”.
If so the first bearish trigger point is a move below the presumed Minuette wave “(b)’” low at 6,845.61. This break could bring the SPX down to the presumed Minuette wave “[ i ]’’ bottom at 6,831.74.
A move below 6,831.74 could trigger a one day 2% decline.
