Gold in U.S. dollars could soon make am important secondary peak.
The daily spot Gold ($GOLD) chart courtesy of StockCharts.com illustrates the action since November 2025.
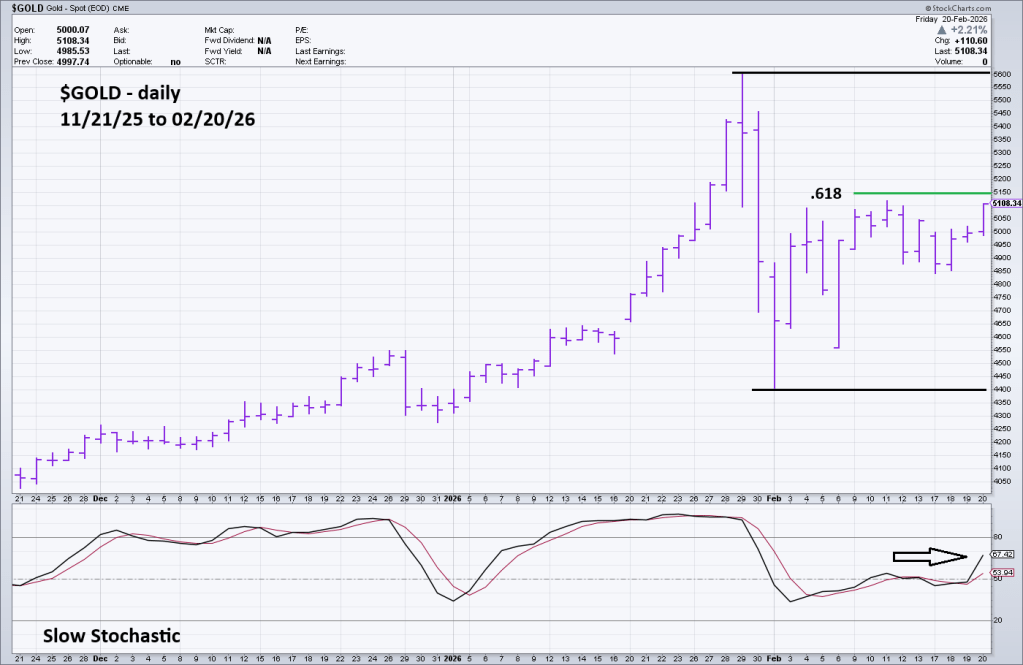
Gold could soon reach a Fibonacci .618 retracement of its late January to early February crash. If it reaches this potential resistance level it may correspond with Slow Stochastic reaching the overbought zone which begins at 80.00.
The hourly Gold in U.S. dollars chart courtesy of Trading view shows a possible Elliott wave count after the late January peak.
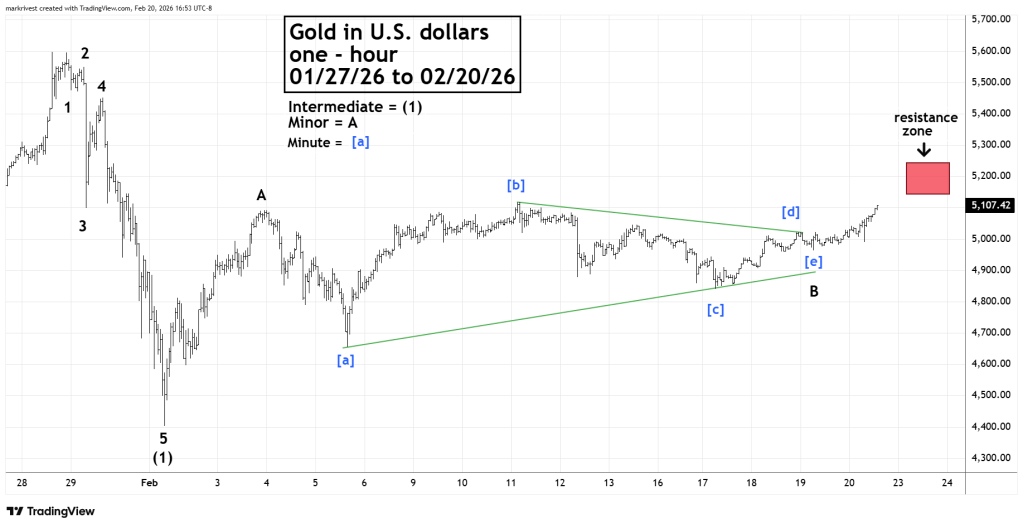
The easiest way to describe Elliott wave theory is “straight lines followed by crooked lines”. The sharp crash after 01/29/26 was followed by a choppy rally. The entire rally could be an Elliott wave – Single Zigzag, with Minor wave “B” forming an Elliott wave – Horizontal Triangle.
If so, the post triangle thrust up could be Minor wave “C” of the Single Zigzag.
The rally could terminate in the broad resistance zone during the last week of February 2026.
