The 02/08/26 blog “Incredible Dow Jones Industrial Average – Time Cycles” illustrated that the Dow Jones Industrial Average (DJI) could be making an important peak near the 60 – year anniversary of the major DJI top made on 02/09/66. The DJI all-time high made on 02/10/26 may have reached its ultimate top one day after the anniversary date.
The daily DJI chart courtesy of Trading View shows what happened after the February 1966 bull market peak.
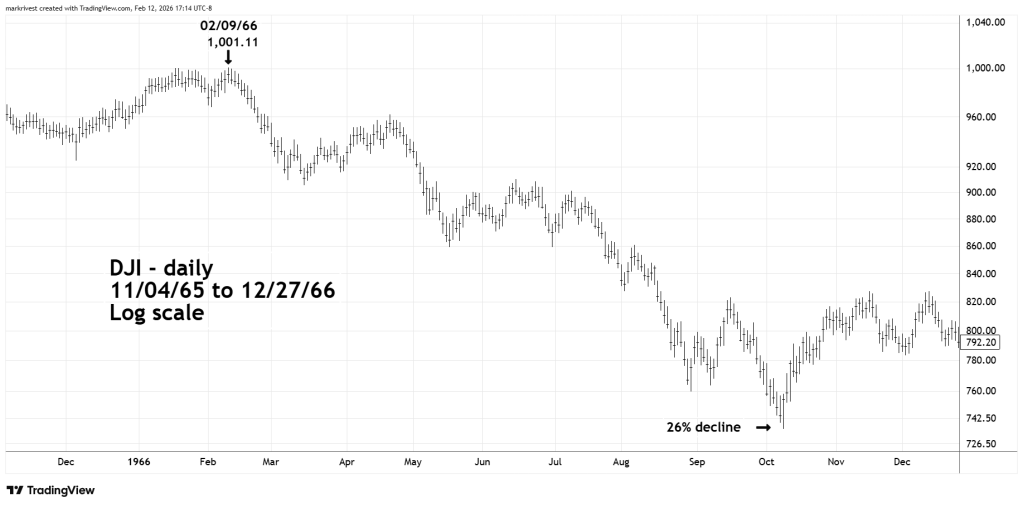
After the February 1966 peak DJI went into a multi-month 26% bear market.
The daily DJI and Dow Jones Transportation Average (DJT) illustrate their current action.
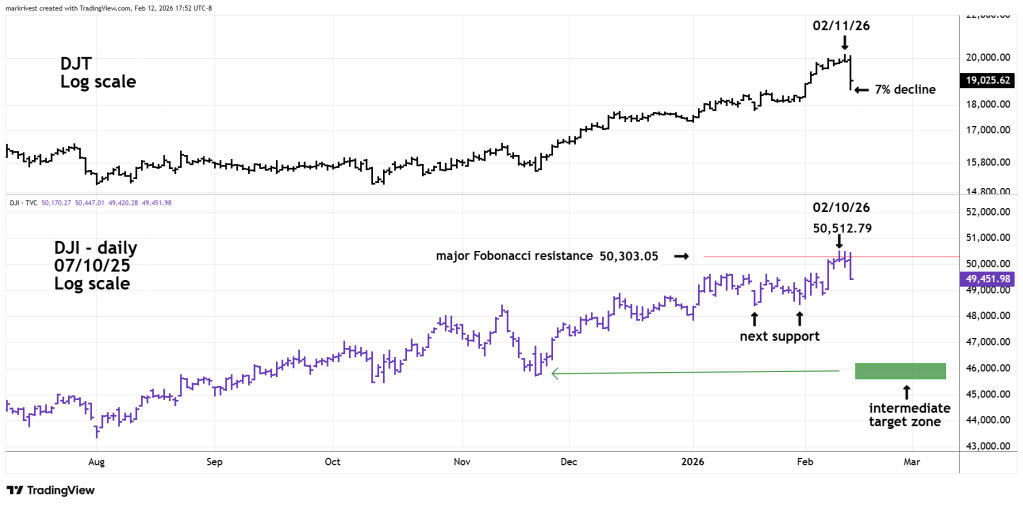
Recent blogs on this website have noted major Fibonacci resistance at DJI 50,303, the peak at 50,512 was only four tenths of one percent from a bullseye hit.
The DJT made its all-time high on 02/11/26. At the intraday low on 02/12/26 DJT was down a spectacular 7%.
Based just on long-term Fibonacci price/time analysis, both DJI and DJT may have made important peaks. A multi- month bear market may have begun.
A quick note about this website. Very recently there’s been a HUGE global spike in views. Please subscribe, like, and share Four Dimension Trading.
