The S&P 500 has broken below a rising daily wedge and could decline to at least the area near the 11/21/25 bottom.
The daily S&P 500 ($SPX) chart courtesy of StockCharts.com illustrates short-term momentum.
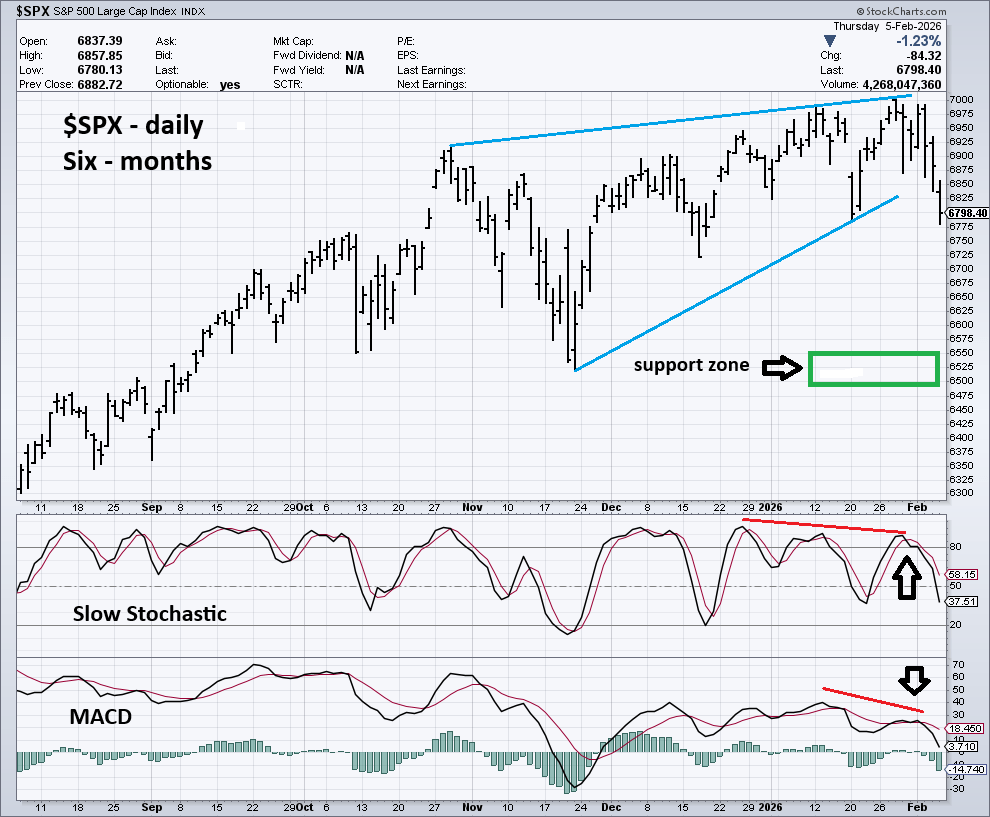
Daily Slow Stochastic made a bearish divergence peak in the overbought zone and now has a bearish line cross. Both lines are now in mid-range implying more downside action until they reach the oversold zone below 20.00.
Daily MACD also had a bearish line cross. Both lines are still well above the “zero” level implying more downside action.
On the bullish side of the coin, on 02/04/26 the NYSE and S&P 500 cumulative Advance/Decline lines made new all-time highs. This hints the current decline may only be a minor correction of an ongoing bull market.
Important support is near the $SPX 11/21/25 bottom at 6,521. This target zone could be reached in five to ten trading days.
