During the last few months, the S&P 500 (SPX) upper part of the post April 2025 rally appeared to be forming an Elliott wave – Ending Diagonal Triangle (EDT). What’s happened during the most recent trading days hints that the entire rally since 04/07/25 could be a colossal Ending Diagonal Triangle.
The daily SPX chart courtesy of Trading View illustrates the potential Elliott wave count.
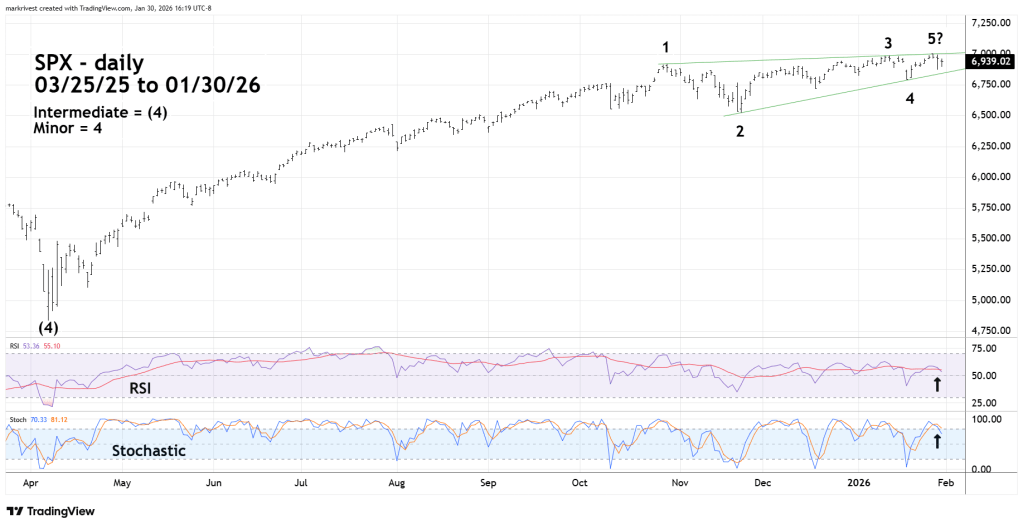
Normally the second wave of an EDT has a deep retracement of the first wave. A Fibonacci .618 retracement is a typical level. In this case the presumed Minor wave “2” is shallow.
Daily Stochastic has bearish lines cross in the overbought zone above 80.00. Daily RSI has moved below its moving average line. These momentum signals imply the EDT could be complete at the 01/28/26 peak.
However, the form of the post 01/28/26 decline looks like an Elliott wave corrective pattern. If so, there could be a marginally new SPX high on 02/02/26.
The 15 – minute SPX chart zooms in on the intraday activity.
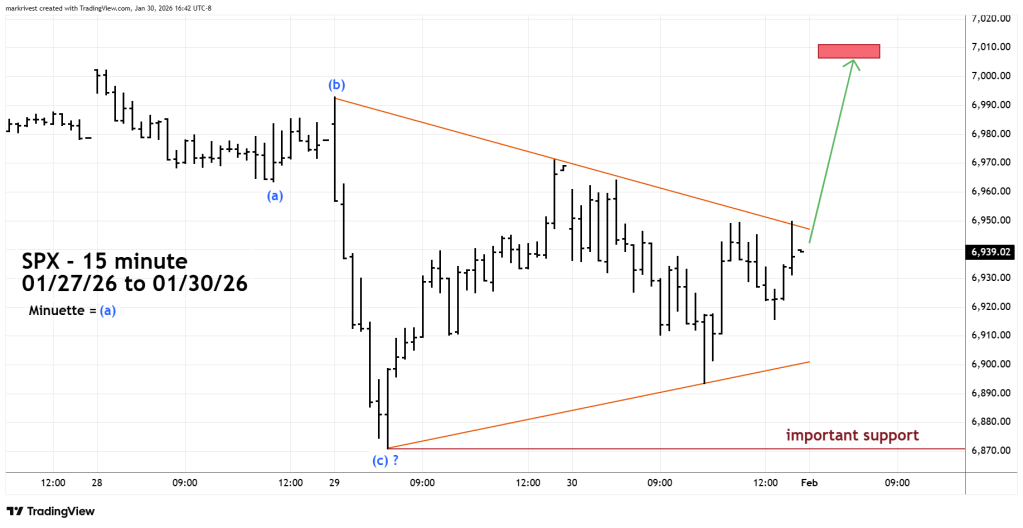
The drop from 01/28/26 to 01/29/26 looks like an Elliott wave – Single Zigzag correction. If so, SPX could rally marginally above the 01/28/26 peak, then quickly decline.
If SPX fails to exceed the 01/28/26 peak – a move below the 01/29/26 bottom at 6,870.80 could be very bearish.
