There was a New Moon on 01/18/26. Sometimes markets can turn on New/Full Moons plus or minus two trading days. Usually, one of the main U.S. stock indices; S&P 500, Nasdaq Composite or Dow Jones Industrial Average register lunar turn signals. In this case the Russell 2000 – small cap index made a post April 2025 rally peak on 01/16/26.
There’s a high probability an effective lunar turn signal has occurred. If so, S&P 500 (SPX) could be in the early part of a 10 to 20% decline.
The weekly SPX chart courtesy of Trading View illustrates important momentum signals.
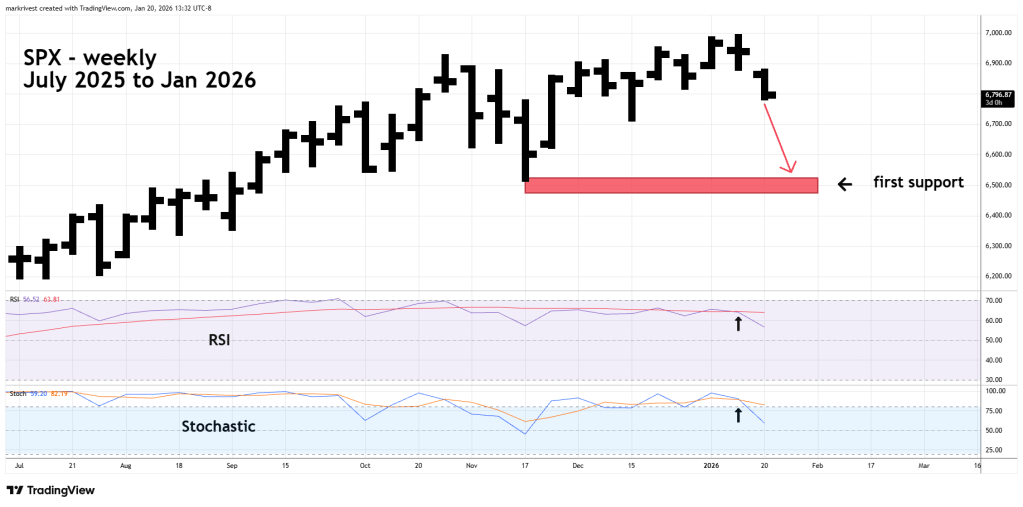
Weekly Stochastic had a bearish line cross in the overbought zone above 80.00.
Weekly RSI has crossed below its moving average line.
First support is in the 6,500 area; this could be reached in one or two weeks.
