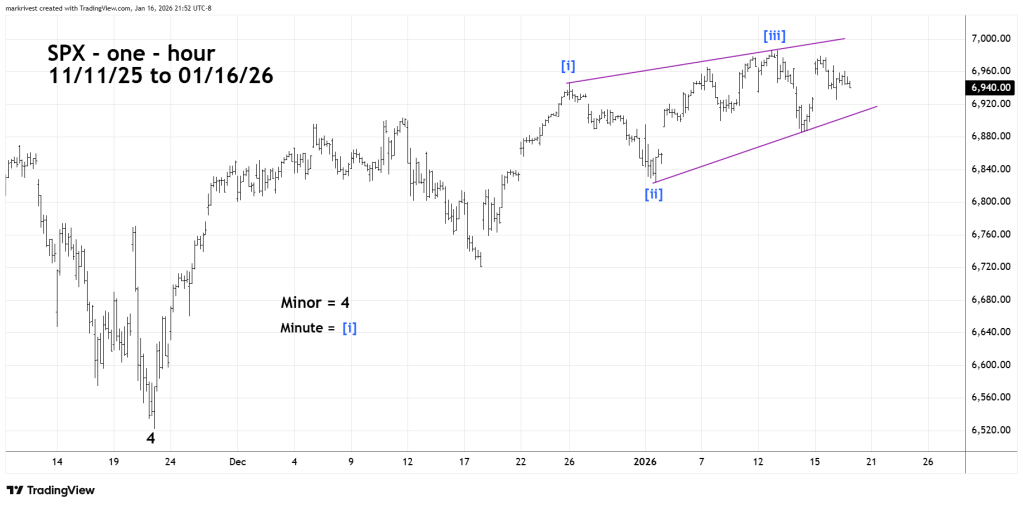
The 01/15/26 blog illustrated that S&P 500 (SPX) could be forming an Elliott wave – Ending Diagonal Triangle from the 11/21/25 bottom. This pattern is still valid and could be completed on 01/20/26.
The SPX one – hour chart courtesy of Trading View illustrates the development since 11/21/25.
The 01/15/26 blog speculated the Ending Diagonal Triangle could be completed on 01/16/26. What happened was not conclusive. The 15 – minute SPX chart zooms in on the short – term action.
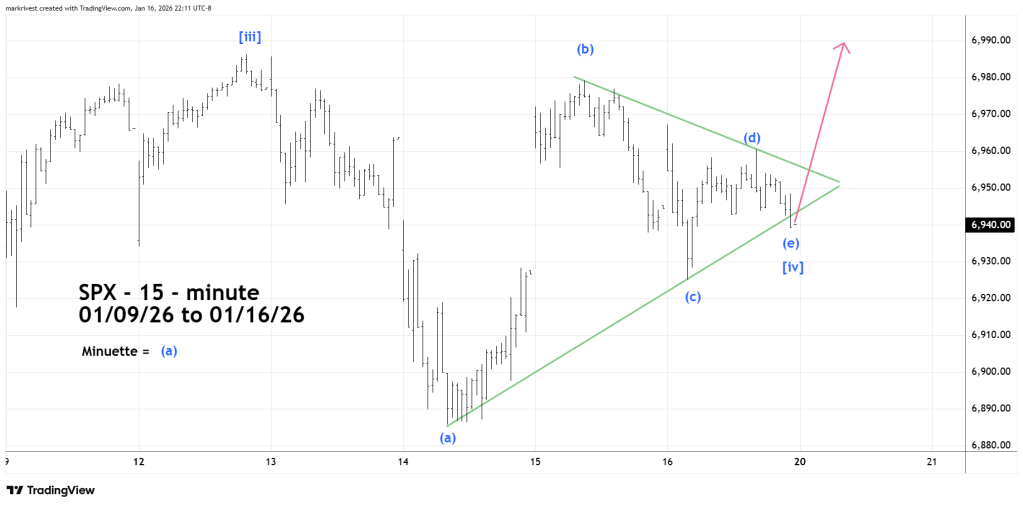
The movement after the 01/12/26 peak appears to be an Elliott wave – Horizontal Triangle. These are net sideways corrections that form in the fourth wave positions of Motive patterns and in the “B” wave positions of Corrective patterns.
After completion of a Horizontal Triangle there’s a move in the direction of the main trend, which in this case is up.
The cash U.S. stock market is close on 01/19/26 for the Martin Luther King Jr. holiday.
If the SPX rallies on 01/20/26, a peak could be made at or just above the rising trendline connecting the 12/11/25 and 01/12/26 peaks.
There’s a New Moon on 01/18/26. Sometimes markets turn on New/Full Moons plus or minus two trading days.
An SPX peak on 01/20/26 would be in the range for a lunar cycle turn.
