Market sentiment can be measured in two ways; bets made by traders such as Put and Call options, or by polling. Market Vane began polling market opinions in 1964. Their Bullish Consensus is the degree of bullish sentiment for a particular market. The Bullish Consensus is compiled by tracking the buy and sell recommendations of leading market advisers and commodity trading advisers relative to a particular market. High Bullish Consensus numbers tend to correspond to market peaks, low numbers relate to bottoms.
The level for U.S. stock market potential peaks begins at 65%. The bottom level begins at 40%.
The weekly S&P 500 (SPX) chart courtesy of Trading View illustrates key Market Vane – Bullish Consensus readings since late 2021.
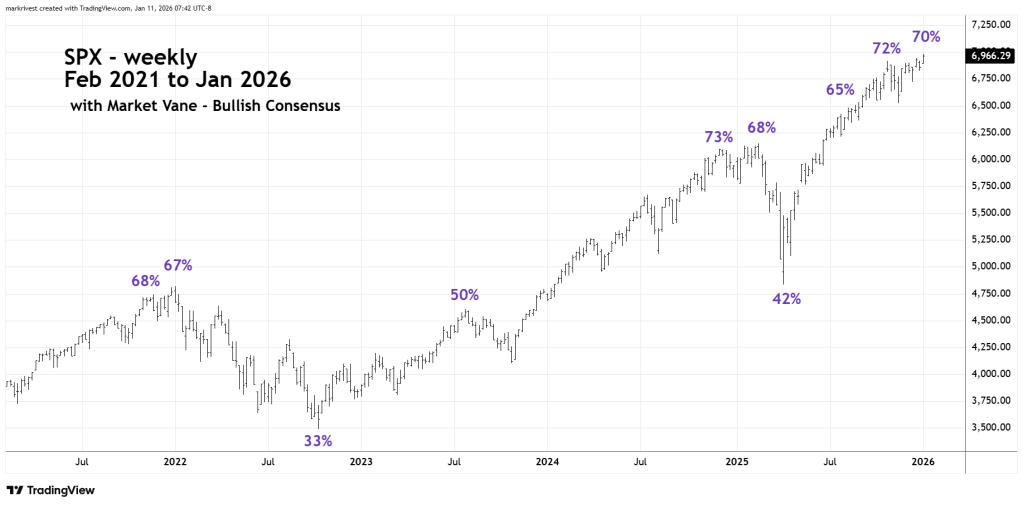
Market peaks can occur on extreme Bullish Consensus or on a divergence. A divergence indicates a subtle shift in sentiment.
Note that the penultimate SPX peak in late 2021 had a higher reading than the ultimate top made in early 2022.
The same phenomenon occurred in late 2024 and early 2025.
The most recent reading in early 2026 is diverging on the peak reading made late October 2025.
A move next week below SPX 6,824.31 could open the door for a multi-month decline.
The daily SPX chart compares its recent action with VIX.
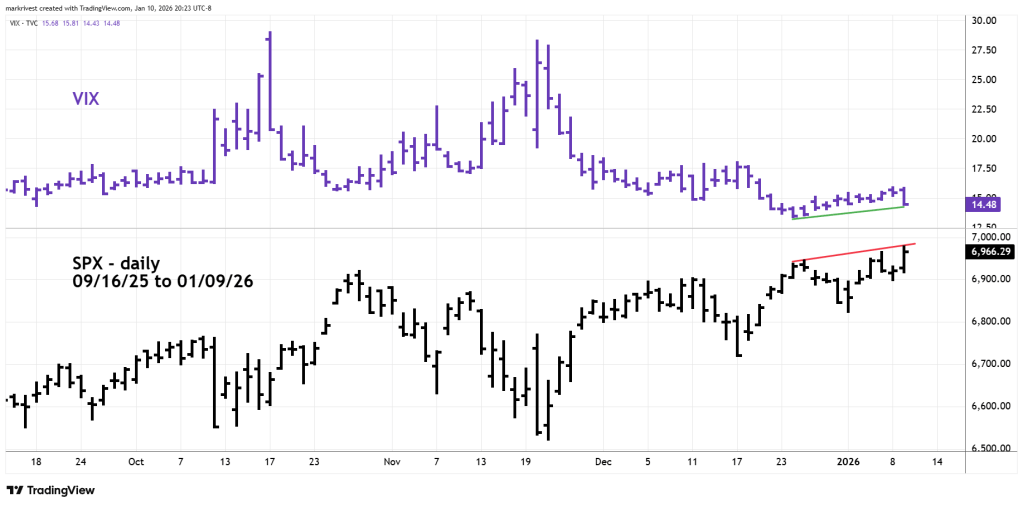
SPX peaks are made on higher VIX bottoms. VIX is composed of Put/Call options, the higher VIX bottoms are a subtle signal that some market participants are hedging with increased Put exposure.
The VIX 01/09/26 reading is higher than what was recorded on 12/24/25. The daily VIX readings confirm the weekly Market Vane readings.
Watch SPX 6,824.31.
