There are always alternate Elliott wave counts. One S&P 500 (SPX) path points to potentially important resistance.
The 30-minute SPX chart courtesy of Trading View shows a possible Elliott wave count.
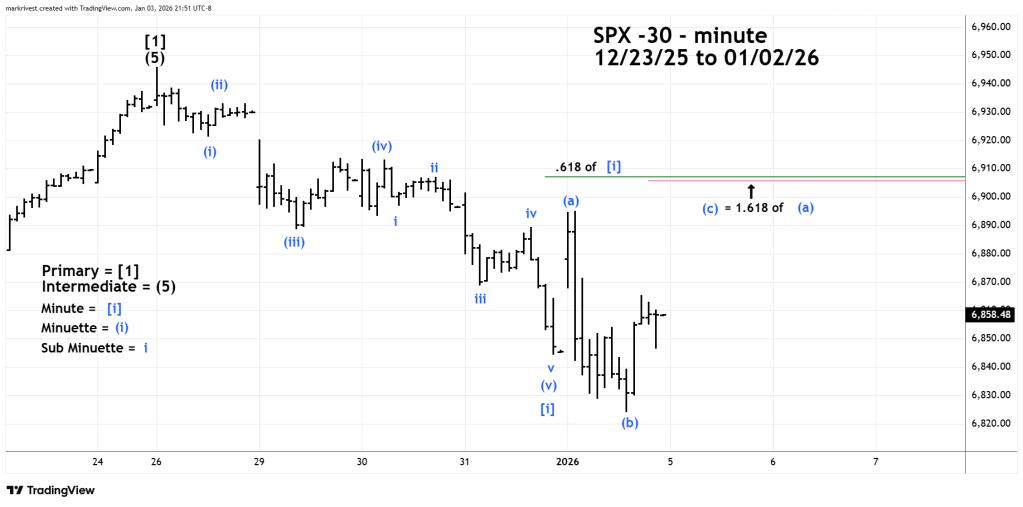
The SPX 12/26/25 to 01/02/26 decline has two Elliott wave interpretations. The entire drop could be a correction of the prior uptrend. Specifically, an Elliott wave – Double Zigzag. Or it could be an Elliott wave – Motive pattern followed by a developing correction of the prior decline.
The pattern illustrated has the Elliott wave impulse – labeled Minute wave [i] bottoming on 12/31/25. The structure formed on 01/02/26 could be a developing Elliott wave – Inverse Expanding Flat correction. These patterns are composed of three sub waves. The first and second sub waves further divide into three waves or a combination of three waves. The third wave is subdivided into five waves.
The most common Fibonacci relationship between waves “c” and “a” in an Inverse Expanding Flat is 1.618. Multiplying the length of the presumed Minuette wave (a) by 1.618 and adding it to the bottom of Minuette wave (b) targets 6,905.90 as a possible termination point for Minuette wave (c).
There are two ways to measure a Fibonacci retracement of a Motive pattern followed by an Inverse Expanding Flat. You can retrace the entire decline which in this case is the drop from 12/26/25 to 01/02/25. Or retrace the decline of just the Motive pattern. In this case is the move down from 12/26/25 to 12/31/25 – labeled Minute wave [i] which targets 6,907.10.
Another method to discover market support/resistance is Volume Profile.
The next 30 – minute SPX chart is overlaid with Volume Profile.
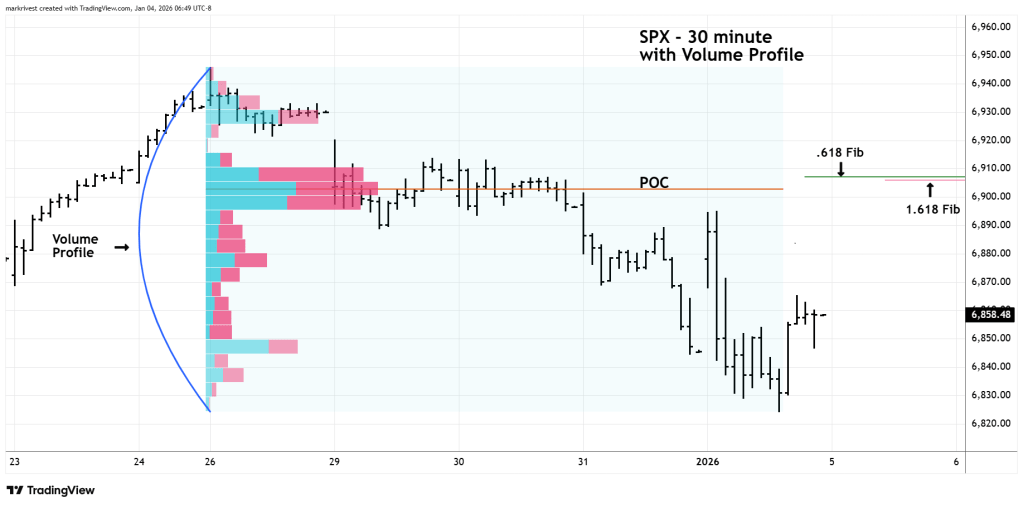
The Volume Profile method places volume on a vertical axis which matches volume and price action. The wider the volume the stronger the potential support/resistance. The widest part of the profile is called Point of Control (POC).
POC at 6,903.00 is close to the two Fibonacci coordinates of 6,905.90 and 6,907.10. This zone could be very powerful resistance.
A break above the low 6,900 area could trigger a move up to major Fibonacci resistance in the 6,950 area.
