When an asset’s price rises at an accelerating, exponential rate it forms a steep curve on a chart. This is called going parabolic, and it’s what’s happening to Silver.
The monthly Silver in U.S. dollars chart courtesy of Trading View illustrates its long-term action.
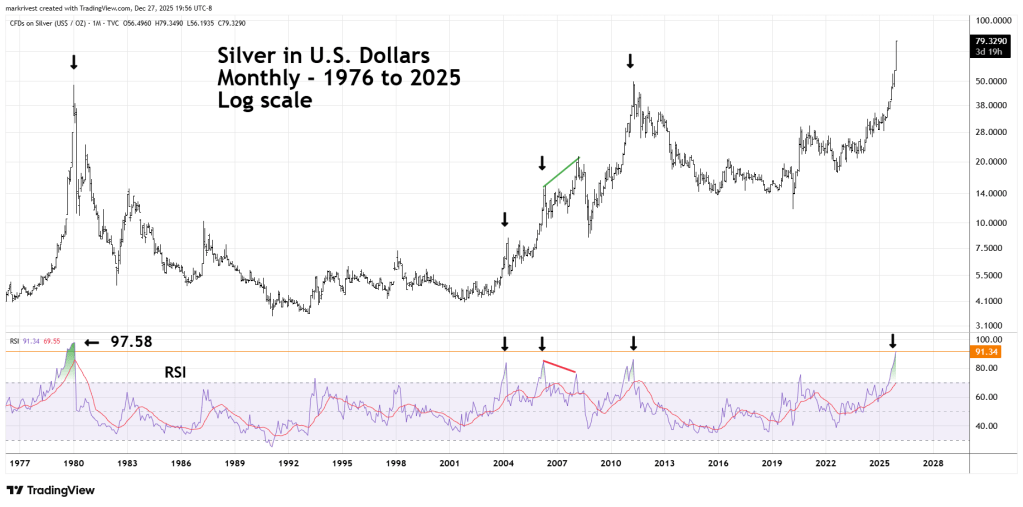
Several of the blogs on this website have noted that most of the time stock indices form significant peaks with at least one bearish RSI divergence. This is because stock indices move up on hope which creates diffused, spread-out tops.
Commodities are different, they rally on fear which is a more intense emotion. The fear of missing out triggers rapid moves up that frequently terminate in blow off tops.
Note that most of the monthly price peaks correspond with RSI maximum readings. The major exception was made from 2006 to 2008.
The current monthly RSI reading is 91.34 deep in the overbought zone which begins at 70.00. It’s also the second highest reading since the massive bull market peak that occurred in early 1980.
The weekly Silver chart examines more recent activity.
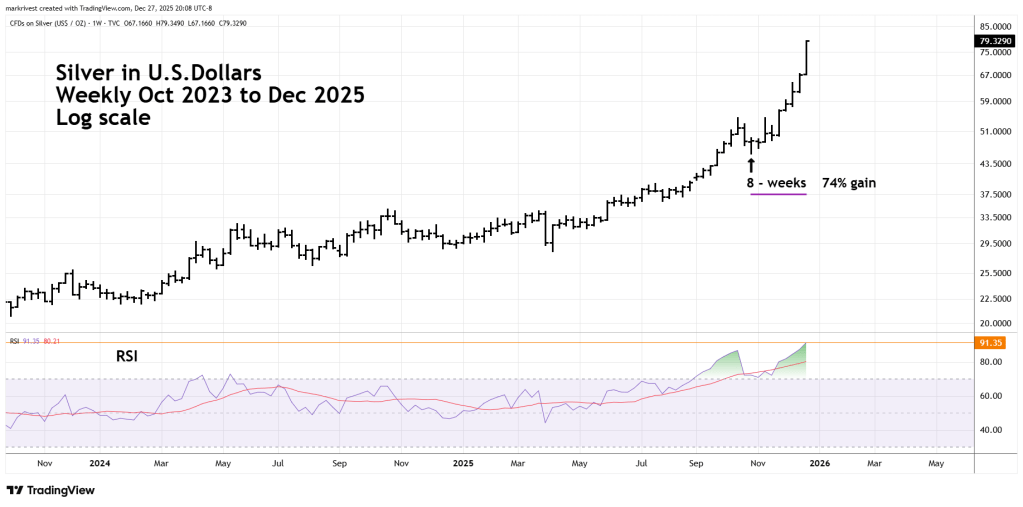
Please note the double RSI peaks made in October and December.
The most recent rally began in late October 2025 and lasted eight weeks with an incredible 74% gain.
The next weekly chart zooms in on the major Silver peak made in January 1980.
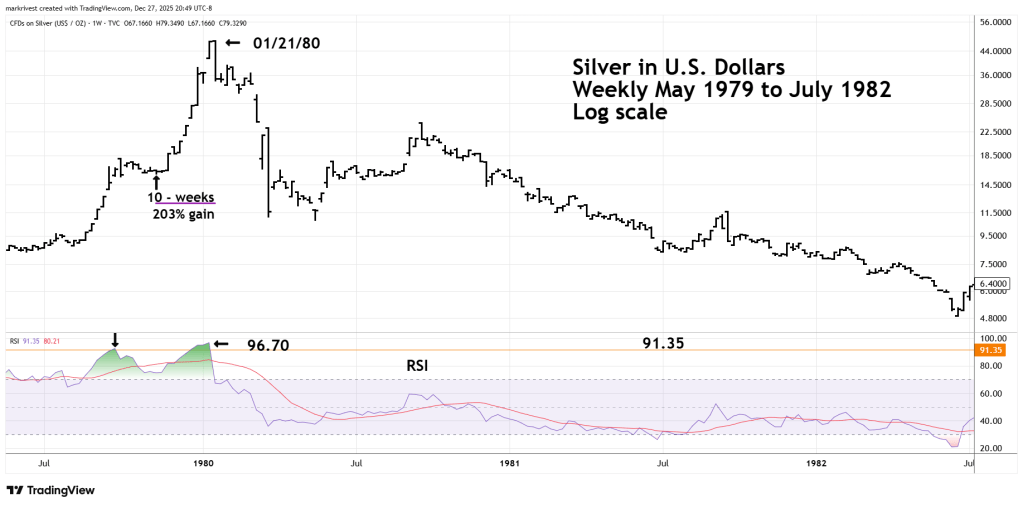
Please note the double RSI peak made in late 1979 and early 1980. The final Silver rally began in November 1979 and lasted ten weeks gaining an incredible 203%!
The late 1979 and early 1980 weekly RSI readings and the final ten-week rally give us parameters of what could happen to Silver in the coming weeks.
If Silver continues to climb, could it move up 203% from the late October 2025 bottom? Siver closed the week of 12/26/25 at 79.32. If it can match the ten – week post November 1979 rally it would bring Silver to around 137.00 sometime in early January 2026.
The low end of a potential topping zone could be in the low 100.00 area
Lunar cycles could be a factor. Sometimes markets can have significant turns at Full/New Moons plus or minus two trading days. There’s a Full Moon on Saturday 01/03/26.
