The 12/18/25 blog “S&P 500 – Elliott Wave Forecast – December 2025- Part – Two” illustrated that the S&P 500 (SPX) could be forming an Elliott Wave – Horizontal Triangle. The subsequent rally above the SPX 12/11/25 peak has invalidated that wave count. SPX has reached an all-time and is close to potentially major Fibonacci resistance.
The daily SPX chart courtesy of Trading View updates the action.
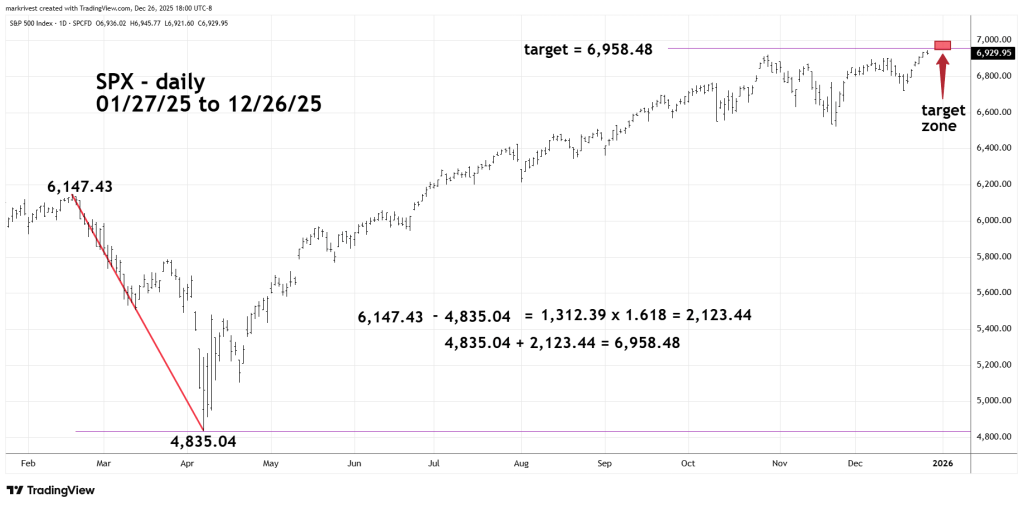
This Fibonacci calculation was noted in the 11/01/25 blog “Bullish Pieces of an Elliott Wave Puzzle” which stated. “Multiplying the February 2025 to April 2025 decline by the Fibonacci inverse ratio of 1.618 yields 2,123.44. Adding this to the 04/07/25 bottom of 4,835.04 targets SPX 6,958.48”.
On 12/26/25 SPX high was 6,945.77 within leeway of the Fibonacci bulls’ eye of 6,958.48.
The 12/13/25 blog “Fascinating Year End Stock Market Turns” illustrated that sometime the SPX can make significant turns on the cusp of a new year. Also noted were lunar time cycles of market turns near Full/New Moons plus or minus two trading days.
The next Full Moon is Saturday – 01/03/26.
If the SPX is near 6,958.48 – 01/02/26 to 01/06/26 a significant peak could be made.
