The prior two blogs “S&P 500 – Elliott Wave Forecast – December 2025” and “S&P 500 – Elliott Wave Forecast – December 2025- Part – Two” speculated that the S&P 500 could make a short-term bottom sometime in late December 2025. Evidence from the NYSE Composite Index (NYA) supports the theory that U.S. stocks could make a short-term low in the next few trading days.
The NYA – 30 – minute chart courtesy of Trading View shows what’s happened from 12/10/25 to 12/19/25.
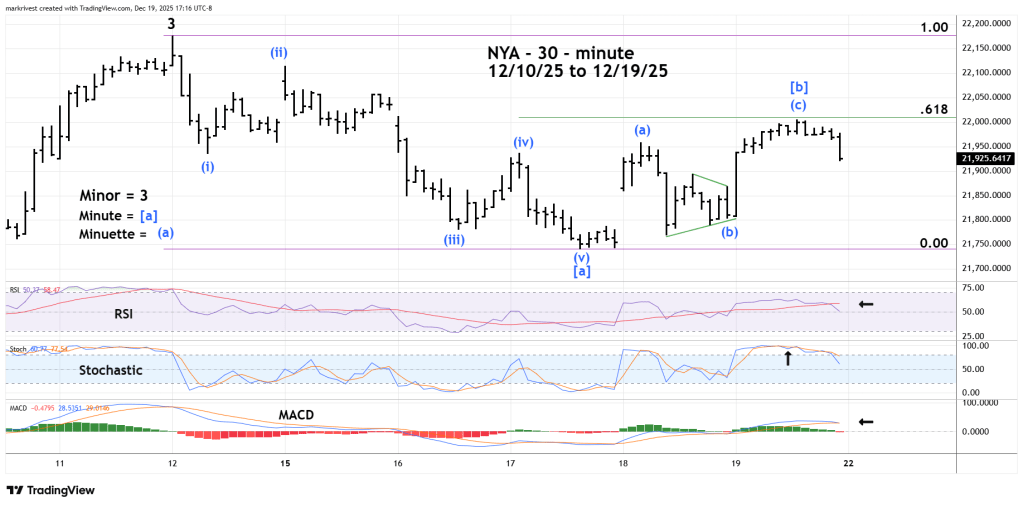
The 12/18/25 blog illustrated that the S&P 500 decline from 12/12/25 to 12/17/25 could be the first wave down of a developing three wave correction. The corresponding NYA decline took the form of an Elliott wave – Impulse pattern. The most likely Fibonacci retracement after the first movement up or down is the golden ratio of .618. The NYA high on 12/19/25 was just below a .618 retracement of the prior five – wave decline.
The subsequent rally looks like an Elliott wave – Single Zigzag correction. The most fascinating aspect of this formation is the presumed Minuette wave (b) which is an Elliott wave – Horizontal Triangle. This structure only appears in the fourth wave position of motive patterns and in the “B” wave position of corrective patterns.
Evidence from momentum oscillators supports the theory that a short-term peak may have been made on 12/19/25. RSI has moved below its moving average line. Stochastic and MACD have bearish line crosses.
The next NYA – 30 – minute chart shows the action from 11/14/25 to 12/19/25.
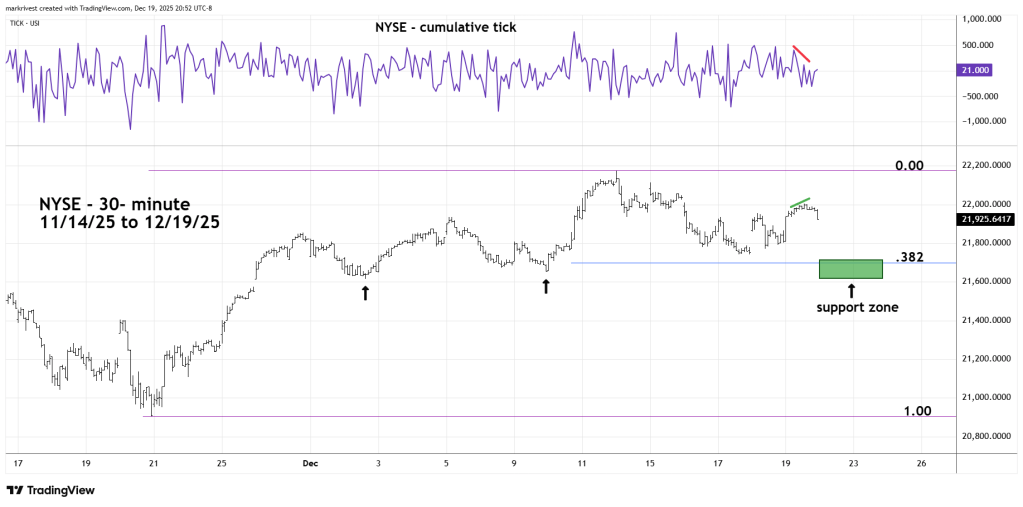
On 12/19/25 NYA was up from its prior day close. Normally on bullish NYA days the NYSE – cumulative tick is in the range of +700 to +1,000. The cumulative tick high on 12/19/25 was only +470. After the tick high, NYA continued to rise while cumulative ticks declined.
Additionally, on 12/19/25 only 50% of the NYA stocks advanced. Internally the NYA 12/19/25 rally was very weak.
The prior two blogs illustrated that the S&P 500 was probably in Minute wave [c] of a developing Horizontal Triangle since the 10/29/25 peak. The NYA – Elliott wave count is different and may be forming only a Single Zigzag Correction after its 12/12/25 top.
If so, its correction could terminate somewhere near a Fibonacci .382 retracement of its November to December rally. This zone is close to a double bottom made in early December.
The time zone for a possible short-term U.S. stock market bottom is 12/22/25 to 12/24/25.
