Powerful bull markets for both Bitcoin (BTCUSD) and U.S. stocks began on 04/07/25. The BTCUSD peak on 10/06/25 could be a sign of an approaching top for U.S. stocks.
The 09/14/25 blog “Bitcoin/S&P 500 – Journey 2022 to 2025” examined the relationship between BTCUSD and the S&P 500 (SPX) from 2022 to 2025.
The weekly BTCUSD and SPX chart from that blog is illustrated below.

Both markets have been trading roughly together since 2022. Divergences in early 2022 and in early 2025 were preludes to deep declines in both markets. In both cases BTCUSD peaked first. The time between peaks in 2021 to 2022 was 56 – calendar days. The second instance in early 2025 was 30 – calendar days. There was a third instance in mid – 2025 that failed to signal a significant peak.
Currently there’s another potential BTCUSD peak signal, this time with a different stock index.
The daily BTCUSD, SPX, and Dow Jones Industrial Average (DJI) shows their relationship since September 2025.
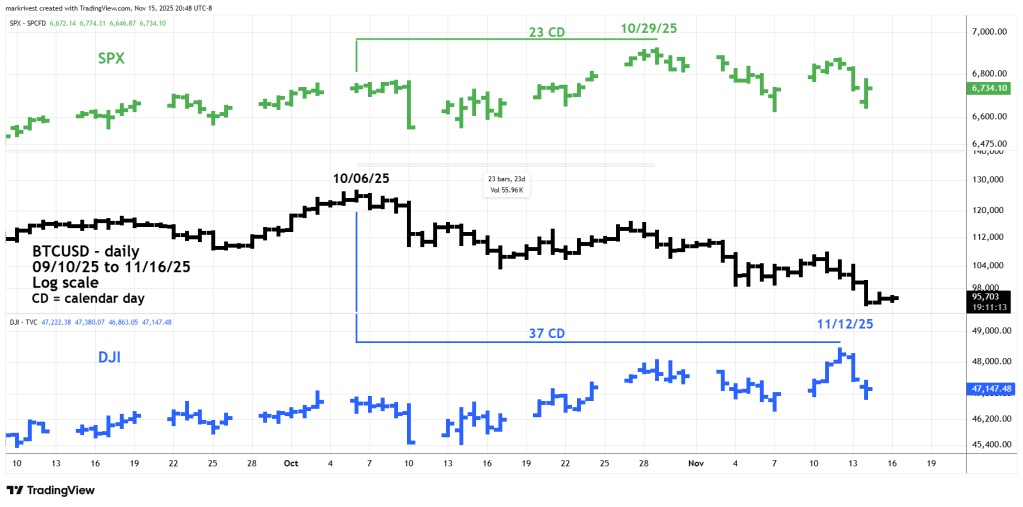
On 11/12/25 the DJI was the only one of the three main U.S. stock indices to make an all-time high. This by itself is a significant bearish signal. The DJI peak came 37 – calendar days after the BTCUSD top and is within the range of 30 to 56 – calendars days established by the peaks made in 2022 and 2025.
Recent blogs on this website have noted that there could still be more upside for U.S. stocks, particularly the SPX. We could have an answer to further upside action in just a few trading days.
One final note on BTCUSD. Going into the SPX January 2022 peak BTCUSD was down 33% from its November 2021 top. Subsequently BTCUSD went into an 11 – month bear market, SPX declined for 10 – months. As of 11/16/25 BTCUSD is down 25% from its 10/06/25 peak.
