The 10/25/25 blog “The Leading U.S. Stock Sector” noted that the PHLX Semiconductor index (SOX) had been a factor in the surge up of U.S. stocks. Recent action implies this leading sector is still bullish.
The weekly SOX chart courtesy of Trading View shows what’s happened.
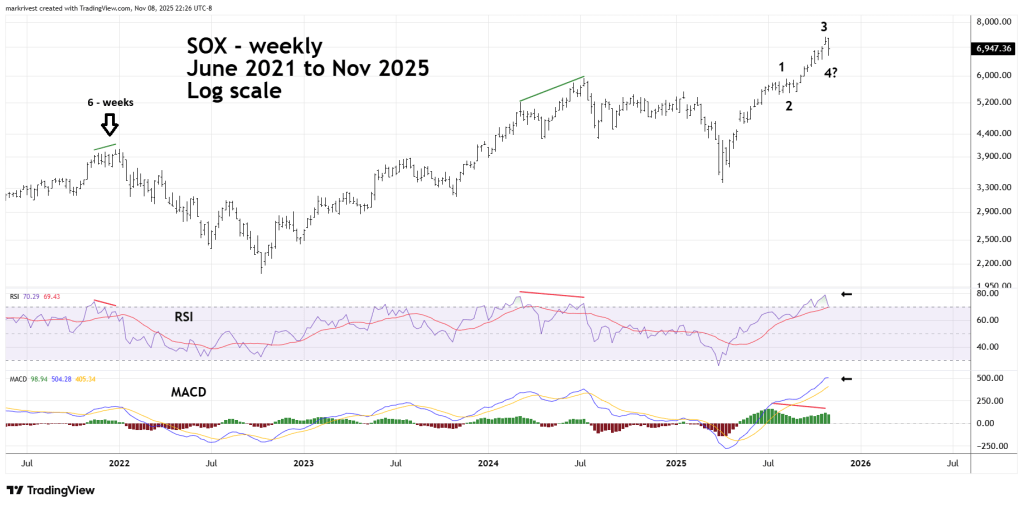
The 10/25/25 blog noted. “Weekly RSI continues to make new post April 2025 highs. Most of the time stocks and stock indices will peak with at least one RSI bearish divergence. The current RSI reading implies SOX may not peak for several weeks”.
The RSI top made in the last week of October 2025 indicates that SOX may have made a penultimate peak, and that the final peak could be made with an RSI bearish divergence.
Please note that the SOX peak made in early 2022 came approximately six weeks after the RSI peak in November. If the current SOX follows the same path the ultimate peak could be reached in early December 2025.
MACD lines are beginning to flatten, which is sign of waning momentum.
There could also be an Elliott – impulse wave forming since the April 2025 bottom. If so, SOX could be in the early part of the fifth and final wave up.
The 30 – minute chart illustrates the intraday relationship between SOX and the S&P 500 (SPX).
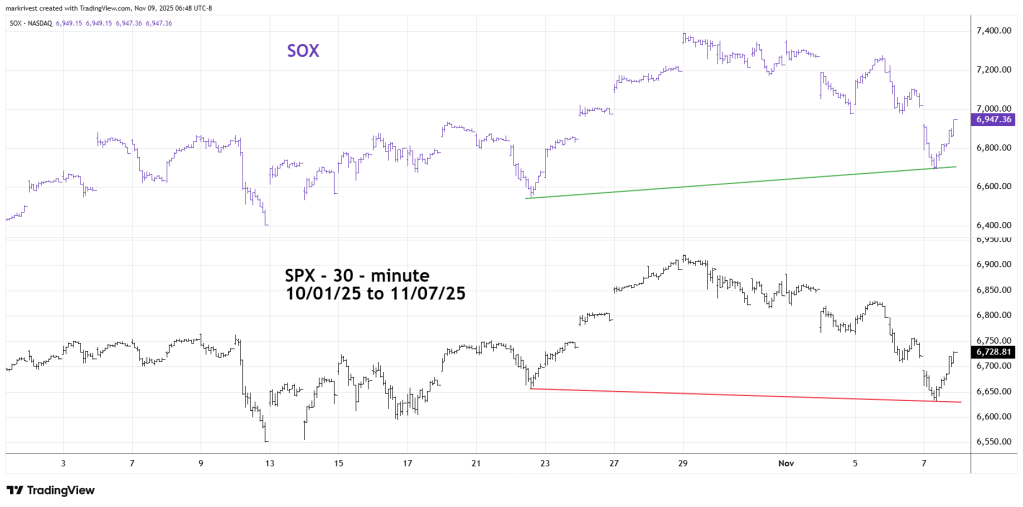
The intraday patterns between the SOX and SPX are very similar. The main difference is that SOX so far has not broken below its 10/22/25 bottom. This is a subtle sign that the decline since the 10/29/25 peak may have ended on 11/07/25.
Watch the SOX it could soon be signaling an important U.S. stock market peak.
