The 10/18/25 blog “Fifty – Year Analysis of the S&P 500” examined the two S&P 500 (SPX) secular bull markets that spanned fifty years. Fibonacci price and time ratios between the two bull markets imply a major peak that could be made in 2025. A look at the at the SPX rise since 2009 reveals additional Fibonacci price and time relationships.
The monthly SPX chart courtesy of Trading View updates the Fibonacci time ratio chart illustrated in the 09/01/25 blog “Precise Time Cycle – August 2025”
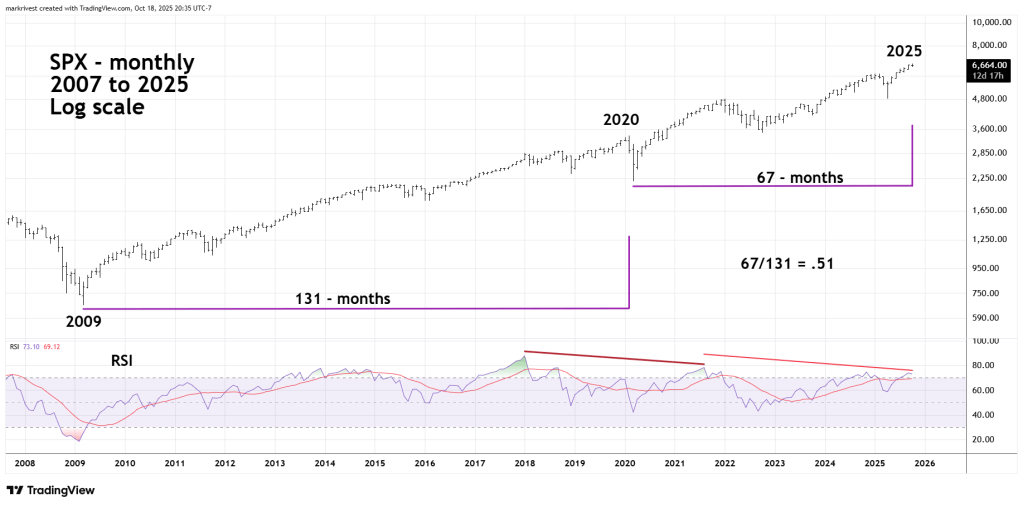
There’s always leeway when using Fibonacci ratio analysis. The 09/01/25 blog noted that August 2025 was the bullseye month for a potential SPX turn, specifically a peak. SPX continued to rally into October and is still within leeway of the Fibonacci 1/2- or .50-time ratio.
Also note that the monthly RSI, just like the yearly RSI illustrated in the 10/18/25 blog, is in the overbought zone with multiple bearish divergences. A very bearish combination.
The next monthly SPX chart shows a Fibonacci price ratio relationship.

When measuring markets with large percentage gains it’s more appropriate to compare growth rates.
It’s interesting that the price ratios from the two secular bull market segments is .51 the same as the Fibonacci time ratio.
The long-term Fibonacci price and time ratios combined with bearish momentum and sentiment evidence make a powerful case that U.S. stocks could be forming a major peak.
However, for several months there’s been a stock buying mania and it could continue. All buying manias eventually end. When they do end it’s very bad for the bulls.
