Very long-term Fibonacci price and time ratios imply S&P 500 (SPX) could make a significant peak sometime in 2025.
Because of the fractal nature of markets Fibonacci price and time analysis can be made on any time scale, from minutes to centuries. The yearly SPX chart courtesy of Trading View examines two bull markets that have occurred over a fifty – year time span.

After the 50% bear market from 1973 to 1974 – SPX was in a 26 – secular bull market which peaked in early 2000. The period from 2000 to 2009 in Elliott wave analysis is the correction of a bull trend, specifically an Expanding Flat.
These structures are composed of three waves. In this case the first wave was the 50% decline from 2000 to 2002. The second waves of Expanding Flats move marginally beyond the starting point of the first wave. This was the 5 -year bull market that terminated in 2007 just above the peak made in 2000. The third wave ends beyond the termination point of the first wave. This was the 2007 to 2009 bear market which bottomed below the low made in 2002.
What came after the 2009 bear market bottom has been another secular bull market that has so far lasted 16 – years.
The ratio of 16 to 26 is .615 very close to the golden Fibonacci ratio of .618.
This is yearly analysis so the ultimate peak could occur anytime during 2025. If the 10/09/25 SPX peak is exceeded the ultimate peak could occur anytime until the last trading day of December 2025.
What if the SPX continues to make new all-time highs in 2026? If so, the secular bull market could continue until the next Fibonacci time ratio. In this case the bull market could last another 10 – years equaling the 26 – years of the 1974 to 2000 move up.
Please note that the yearly RSI is currently deep in the overbought zone – above 70.00 and has a double bearish divergence.
The next yearly SPX chart illustrates a potential Fibonacci price ratio.
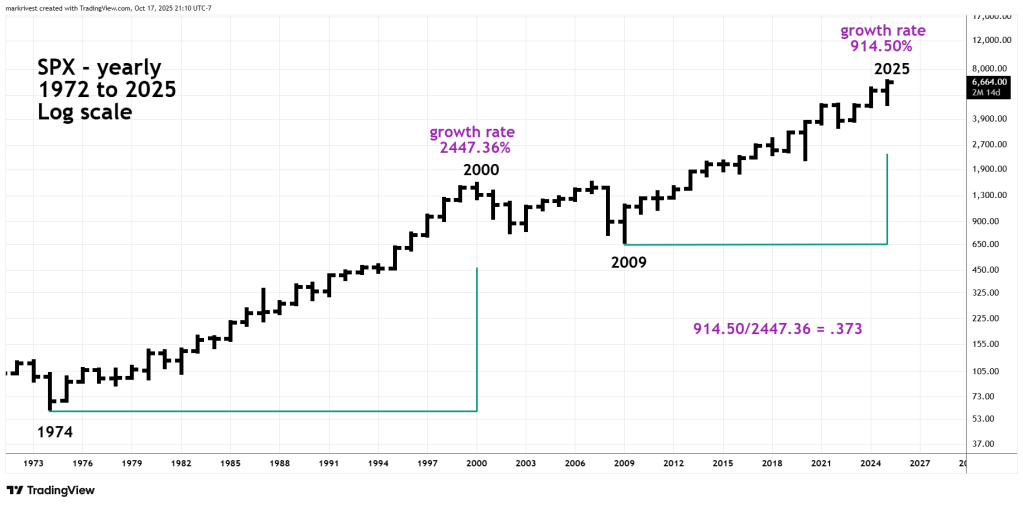
When markets have significant percentage gains it’s more appropriate to examine growth rates.
The 1974 to 2000 bull market had a growth rate of 2,447.36%. The growth rate of the 2009 to 2025 bull market is so far 914.50%. The ratio of 914.50 to 2,447.36 is .373 within leeway of the Fibonacci ratio of .382.
It’s possible the SPX could continue to rally and reach .382 or go slightly beyond that ratio.
The combination of major Fibonacci price/time ratios in 2025 hints that a peak like what happened in 2000 and 2007 could be developing.

Hi Mark,
Great Article !
Please call me this weekend if you have a chance.
‘
Joe
LikeLike