The 10/09/25 blog “Watch the Nasdaq Composite on – 10/10/25” noted.
“At the open of the main trading session on 10/09/25 both the Nasdaq Composite (IXIC) and S&P 500 (SPX) made new all-time highs then quickly declined. The other main U.S. stock index, Dow Jones Industrial Average (DJI) lagged below its all-time high made on 10/03/25.
It’s possible that on 10/10/25 only the IXIC could reach a new all-time high”.
In the first 15 – minutes of trading on 10/10/25 the IXIC made a new all-time high unconfirmed by both the SPX and DJI.
Apparently big money players were paying attention to this very bearish momentum divergence and acted on an announcement by President Trump.
The 30 – minute SPX chart courtesy of Trading View shows what happened.
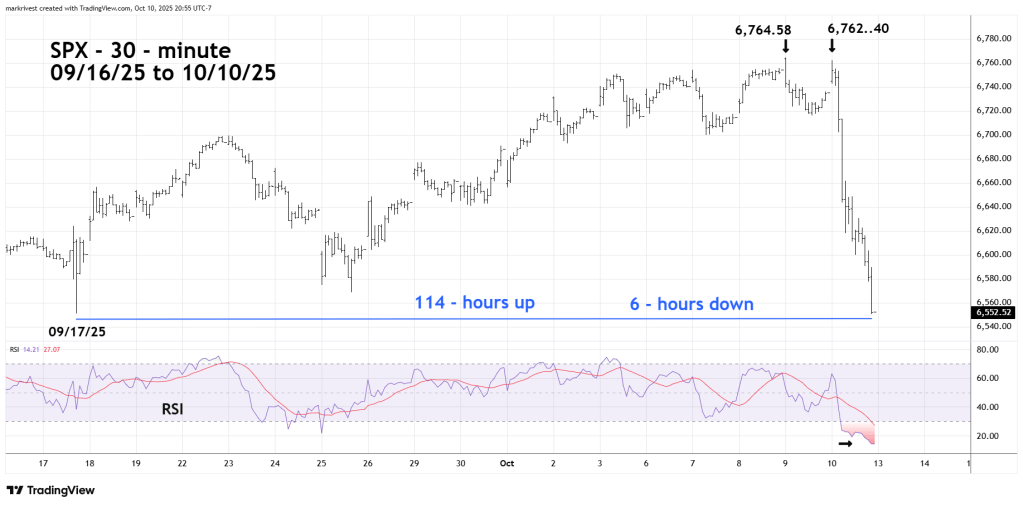
Even though the SPX pushed above Fibonacci resistance at 6,745 to 6,750 it still held below the next Fibonacci resistance level – the 10/09/25 peak. Subsequently there was a devastating micro crash.
Upside progress of 114 – trading hours was wiped out in only 6 – trading hours!
SPX ended the 10/10/25 trading session just below the bottom made on 09/17/25.
Please note the 30 – minute RSI was deeply oversold at the end of the 10/10/25 session. It’s possible a bottom could be in place as of the end of the 10/10/25 trading session. If the SPX goes lower on 10/13/25 watch for RSI bullish divergences.
U.S. stocks are seasonally bearish from August until October. Many significant market bottoms have occurred in October, with 2022 and 2023 being recent instances.
A significant bottom may have formed on 10/10/25, though current momentum and sentiment indicators do not support this outcome.
The next blog will examine long – term momentum and sentiment readings.
