At the open of the main trading session on 10/09/25 both the Nasdaq Composite (IXIC) and S&P 500 (SPX) made new all-time highs then quickly declined. The other main U.S. stock index, Dow Jones Industrial Average (DJI) lagged below its all-time high made on 10/03/25.
It’s possible that on 10/10/25 only the IXIC could reach a new all-time high.
The 15 – minute SPX and IXIC chart courtesy of Trading View illustrates their intraday action.
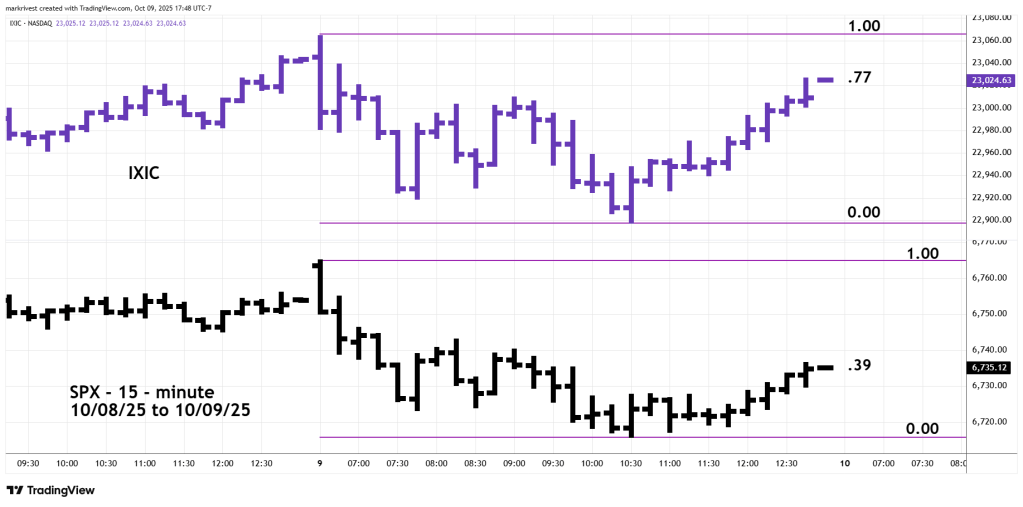
At the end of the 10/09/25 trading session IXIC had retraced 77% of its intraday decline. SPX had retraced only 39%. It’s possible on 10/10/25 – IXIC could reach an all-time high with SPX failing to reach a new high.
If so, where could SPX find resistance?
The 15 – minute SPX chart shows a potential developing Elliott wave count.
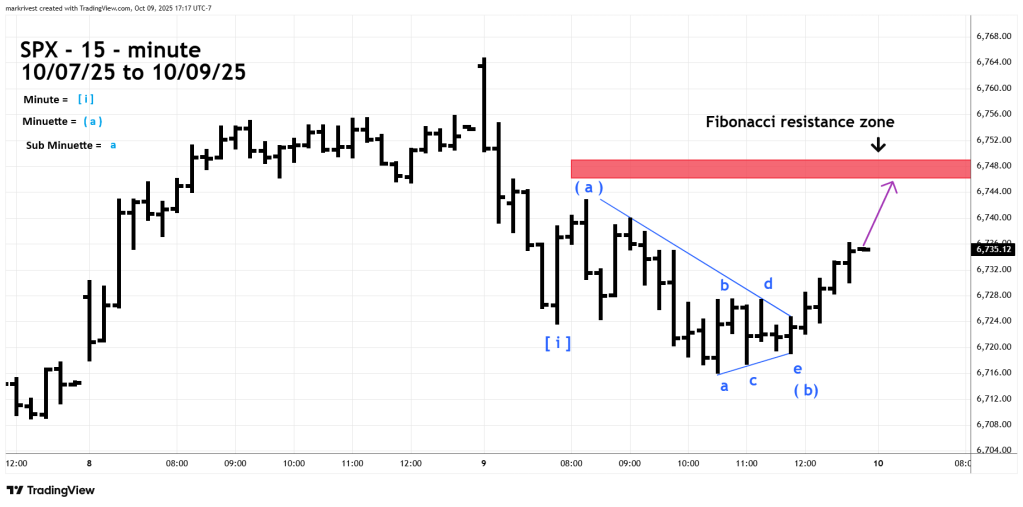
The SPX could be forming an Elliott wave – Inverse Expanding Flat correction. In this pattern the third wave – ( c ) terminates just beyond the first wave ( a ).
The resistance zone is from 6,745 to 6,750. The lower boundary is a Fibonacci .618 retracement of the entire 10/09/25 decline. The upper boundary is a Fibonacci .618 retracement of the presumed Minute wave [ i ].
If early in the 10/10/25 trading session IXIC makes an all-time high unconfirmed by the SPX and DJI an important peak could be formed.
