After the S&P 500 (SPX) bottom on 04/07/25 there were two mid – April declines of 6%. The subsequent rally has been persistent with only shallow drops. Could the SPX decline after the 09/23/25 peak be another shallow decline? There are two price levels to watch during the 09/29/25 to 10/03/25 trading week.
The daily SPX chart courtesy of Trading View updates its action.
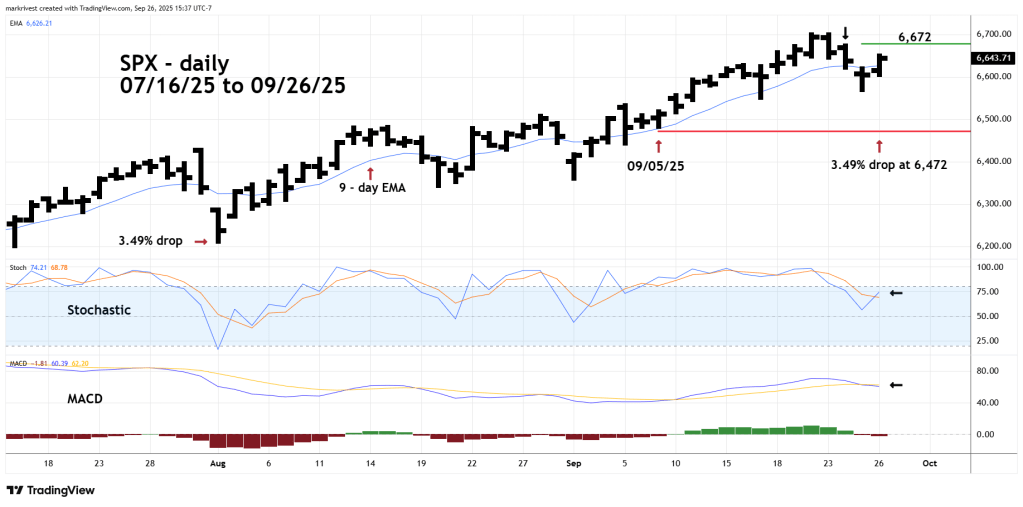
SPX fell 3.49% in the 07/31/25 to 08/01/25 correction, this was the largest drop since mid – April. An SPX move below 6,472 could be a clue that something more bearish than a shallow correction is developing. Note that 6,472 is below chart support at the 09/05/25 bottom.
Important resistance is at 6,672, a move above that level opens the door for another all-time high.
The message from momentum oscillators is mixed.
Daily Stochastic has a bullish line cross.
Daily MACD has a bearish line cross.
The 9 – day Exponential Moving Average (EMA) could be the deciding factor. On 09/26/25 the SPX moved and closed above the 9 – day EMA line.
If next week SPX does make a new all-time high, watch to see if the Dow Jones Industrial Average, and Nasdaq Composite also make new highs.
