On 09/11/25 for the second time in two weeks all three main U.S. stock indices: S&P 500 (SPX), Dow Jones Industrial Average, and Nasdaq Composite made new all-time highs. For at least the short-term this is a bullish signal.
Another bullish signal is illustrated on the 30-minute SPX chart courtesy of Trading View.
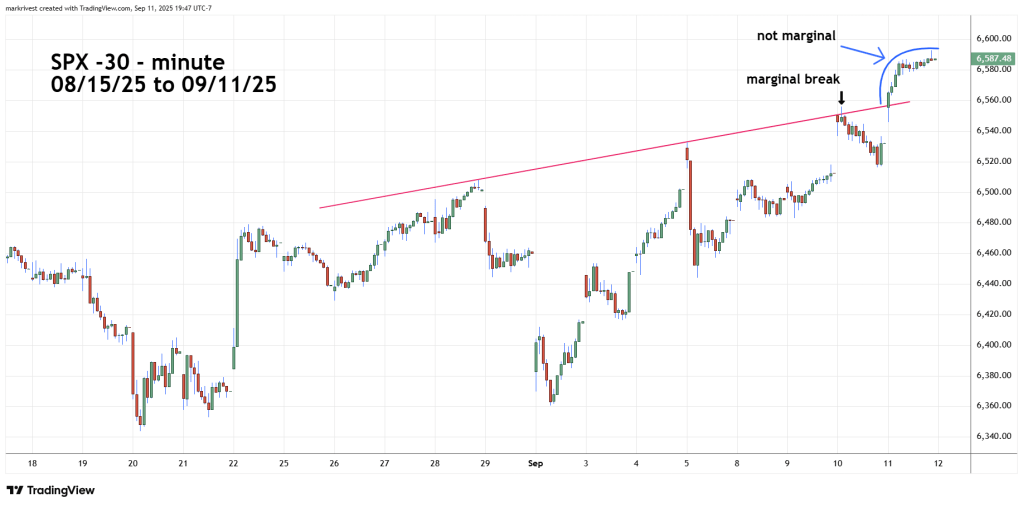
The 09/06/25 blog “Reunion and Rejection” speculated that the SPX could be forming an Elliott wave – Ending Diagonal Triangle. In this structure there’s frequently a marginal move beyond the trendline connection the termination points of the first and third waves.
In this case these are the SPX peaks made on 08/28/25 and 09/05/25. On 09/10/25 there was a marginal break above the trendline that occurred with only SPX making a new all-time high. At the time it looked like a major peak had been made. However, the bear market only lasted five – trading hours.
The trendline break on 09/11/25 was sustained throughout the remainder of the trading session. There’s a high probability the presumed Ending Diagonal Triangle wave count has been invalidated.
The sustained upside break is another short-term bullish signal.
Perhaps U.S. stocks are rallying into the next FOMC meeting which ends on 09/17/25. If the rally goes into 09/17/25 it could be a sell on the news scenario.
