On 08/27/25 and 08/28/25 the S&P 500 (SPX) made all-time highs unconfirmed by the other two main U.S. stock indices: Dow Jones Industrial Average and Nasdaq Composite. This is a major bearish momentum divergence. However, on 08/28/25, VIX made a new post 04/07/25 bottom. All the major SPX peaks since March 2000 have occurred with VIX at a higher bottom.
This mixed signal opens the door for more upside SPX action. Anything can happen in the markets, and we need to be prepared for everything.
If the SPX is making an unprecedented major peak with a VIX bottom, then perhaps there could be an important bear signal generated by downside action.
The daily SPX chart courtesy of Trading View illustrates a very important trendline.
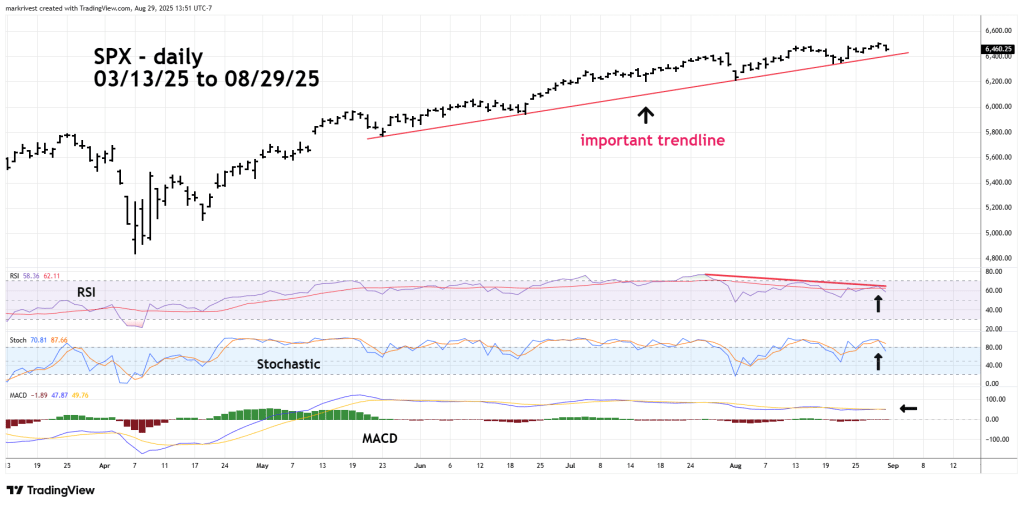
Four times since 05/23/25 the SPX has found support at the rising trendline. The trendline is near SPX 2,420, a decisive break below this line could trigger heavy selling.
Daily RSI has a double bearish divergence and has crossed below its moving average line.
Stochastic has a bearish line cross.
MACD lines and Histogram have been declining.
The SPX recent peaks occurred after the Lunar time cycle zone on 08/25/25 and 08/26/25. However, the broader bearish seasonal pattern for U.S. stocks is from August to October. Statistically September is the most bearish month for U.S. stocks.
The first main trading session for SPX is 09/02/25.
