The S&P 500 (SPX) is in a position where a series of sell orders could be triggered in rapid succession.
The domino theory is the idea that if one thing falls, a lot more things will fall, too, like a line of dominoes.
The 10 – minute SPX chart courtesy of Trading View illustrates where the first domino could be located.

The double bottom at SPX 6,201.00 and 6,201.59 could be an important breakthrough point.
There are two factors in determining the importance of double bottoms/tops, closeness in price and distance in time.
The two price coordinates are almost identical – separated by only .59 points. The closer the price coordinates the stronger potential support/resistance. Market participants see the closeness and in the case of bottoms speculate it could be an area to buy. To overcome this latent buying requires powerful selling.
Time distance between the close bottoms also emphasizes support. Breakthroughs of double bottoms/tops are related by the time between the two points. For example, a double bottom separated by one – trading hour could have a breakthrough move that lasts for one or several trading hours.
The SPX bottoms at 6,201.00 and 6,201.59 are separated by more than six – trading days, implying a break below could continue for six trading days or perhaps several weeks.
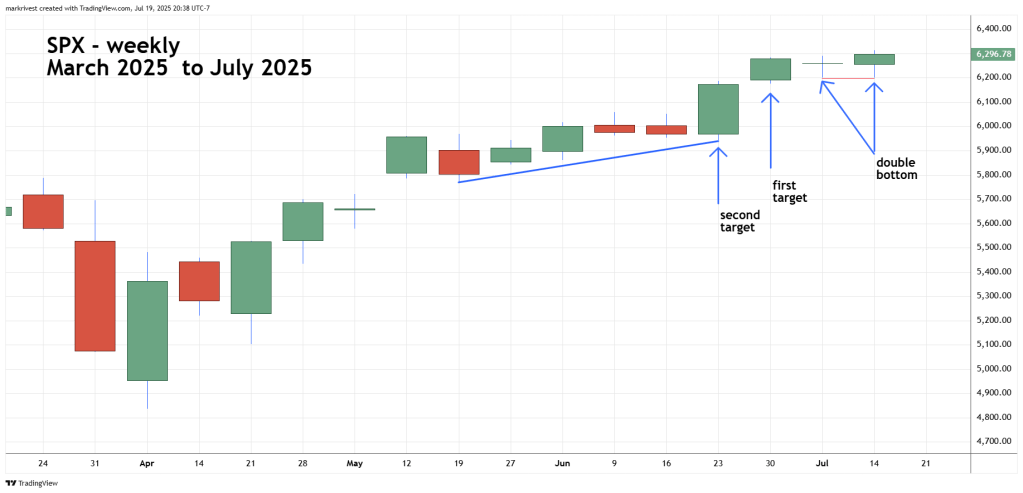
The weekly SPX chart shows potential selling areas.
Several blogs on this website have illustrated buy/sell points using the Strat method. A basic feature of this methodology is that a move above/below the most recent price bar could trigger a move to at least the prior price bar, high or low. If the high/low of the prior price bar is broken this could trigger a move to the next prior bar high/low.
This theory ties in with the placement of stop buy/sell orders. If, for example, selling reaches a support area, the down move could trigger stop sell orders fueling more downside action to the next support area. It’s possible a series of stop sell/buy orders could fall like dominoes.
In the current SPX environment, a move below 6,201.00 targets the low of the prior weekly bar at 6,174.97, a small 26 – point move.
The next prior bar is called an outside bar; its action took it below the prior weekly low and above the prior weekly high. This weekly bar is an example of a powerful bullish movement.
The bulls not only overcame an apparent bear victory with a downside breakthrough, but they also overcame selling at the prior weekly high. It could require very powerful selling to plow through the bullish outside bar.
If the bears can accomplish this feat it sets up the possibility to break below the rising trendline from mid – May. This scenario could bring in even more selling.
A break below the double bottom at 6,201.00 – 6,201.59 could start a move down to the 5,600 are in one or two weeks.
