Momentum and sentiment signals on 07/18/25 imply U.S. stock market bulls could soon be experiencing pain.
The daily NYSE – 52 – week highs chart courtesy of Barchart.com updates internal U.S stock market momentum.
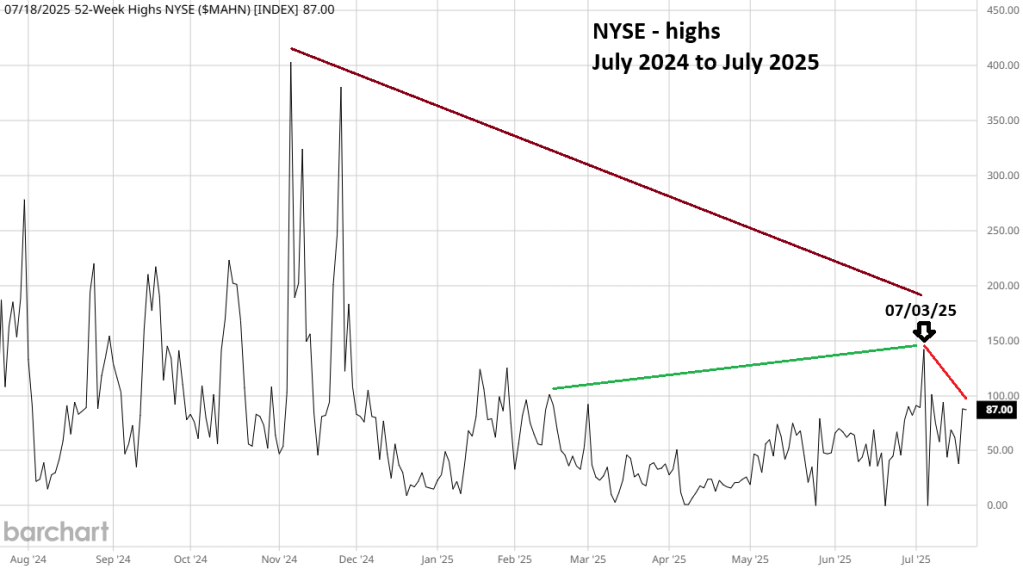
On 07/03/25 the S&P 500 (SPX) made a new all-time high. At the same time NYSE – 52 – week highs surged above their peak made in mid – February 2025. The SPX prior all-time high was in mid – February. The 07/03/25 surge in new highs implied more upside price action. However, note the massive bearish divergence vs. the readings in November 2024.
On 07/18/25 the SPX made a new all – time high reaching 6,313.96 this corresponded with a significant NYSE – 52 – week high bearish divergence. Internal momentum is weakening on both the long and short – term.
The daily VIX chart courtesy of Trading View illustrates SPX – sentiment.

The VIX is very effective in identifying SPX bottoms. Upward VIX spikes almost always correspond with SPX bottoms.
With SPX tops it’s different. VIX making new lows is a bullish SPX signal. SPX tops can occur when the VIX makes a higher low.
On 07/18/25 the SPX high was 6,313.96 and the VIX low was 16.28.
On 07/10/25 the SPX high was 6,290.22 and the VIX low was 15.70.
The VIX is determined by Put/Call options. The higher VIX reading implies some market players have increased buying of Put options as a downside hedge. If the VIX divergence remains, it’s a shift in market sentiment from bull to bear.
Two other factors that could be bearish signals.
- Only one of the three main U.S. stock indices; Dow Jones Industrial Average, S&P 500, and Nasdaq Composite making a new all-time high unaccompanied by the other two indices.
- A break below SPX 6,201.00 – more about this in the next blog.
