The 06/15/25 blog “Termination Patterns Completed” illustrated that the S&P 500 (SPX) probably completed an Elliott wave – Ending Diagonal Triangle. Usually after completion of this pattern there’s a rapid change of direction. However, since the SPX 06/11/25 peak the tenacious bulls have kept prices in a sideways range. Could this be the prelude to new heights? On 06/18/25 there was an important clue implying more downside action.
The hourly SPX chart courtesy of Trading View examines its intraday movements.
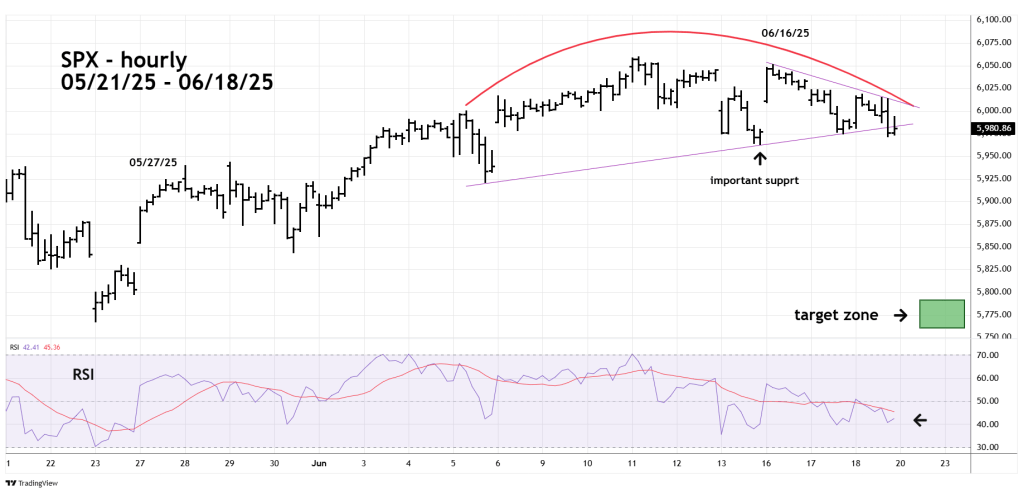
Since 06/05/25 the SPX appears to have formed a rounded top. Also note the rising trendline connecting the 06/05/25, 06/13/25, and 06/17/25 bottoms. On 06/18/25 there was a break below this rising trendline and opens the door for a move below the bottom made on 06/13/25. Usually when there’s a break of a trendline connecting three points, the middle point is the most important.
If the SPX can break below the 06/13/25 bottom there’s a good chance for a rapid move down to the upper 5,700 area.
Hourly- RSI ended the SPX 06/18/25 session at 42.41, the oversold zone begins at 30.00.
Internal momentum for U.S. stocks is also bearish. The NYSE – 52 – week highs chart courtesy of Barchart.com shows what’s been happening.
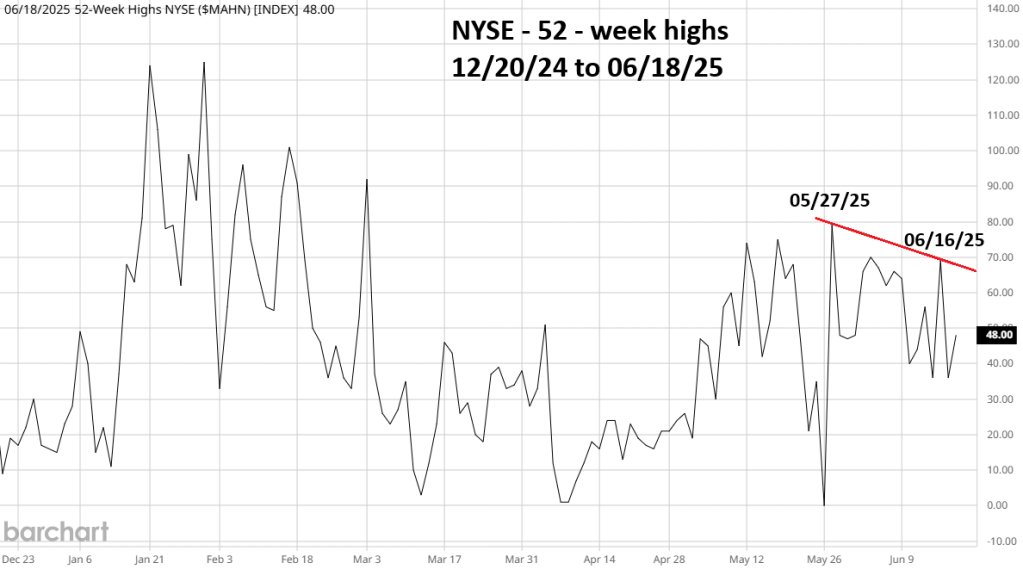
Internal strength for the post 04/07/25 rally peaked on 05/27/25. Note the significant divergence with the SPX secondary peak made on 06/16/25.
If on 06/20/25 the SPX trades below the 06/13/25 bottom, it could trigger a powerful downside movement.
