There’s a high probability that U.S stocks have flipped from a bullish to bearish trend on 06/11/25.
The daily S&P 500 (SPX) chart courtesy of Trading View updates the action.
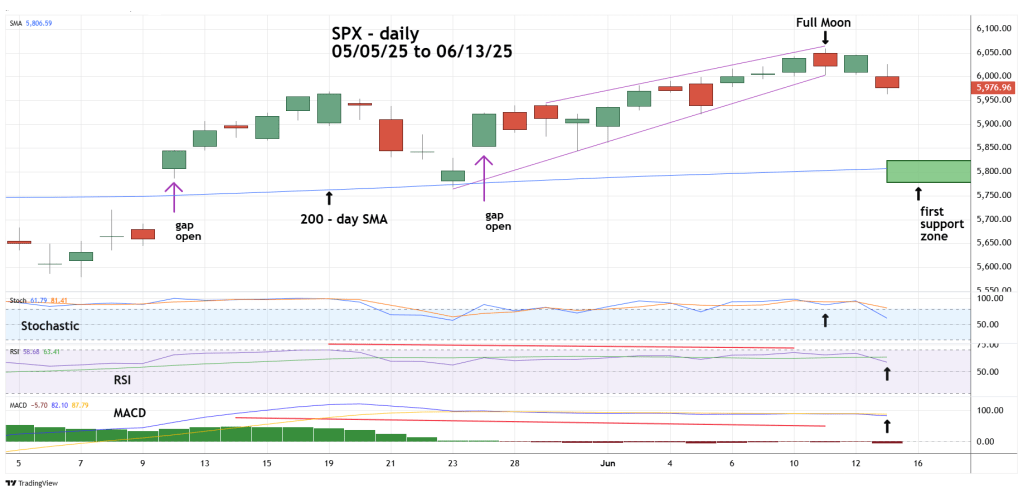
On 06/11/25 the SPX made a new post 04/07/25 rally high, yet it ended the session below the close of the 06/10/25 session.
Also, there was a Full Moon on 06/11/25. Sometimes markets can turn on Full/New Moons plus or minus two trading days. Lunar turns signals usually come during high emotion movements. One way to measure emotional intensity is gap openings. There have been four SPX gap openings since the start of the 04/07/25 rally. Two of the gap openings are shown on the chart.
The SPX move up from 05/23/25 to 06/11/25 was a bearish rising wedge and on 06/13/25 there was a break below the lower trendline.
Daily Stochastic was in the overbought zone and had a bearish line cross.
RSI had a bearish divergence and has crossed below its moving average line.
MACD has a bearish line cross with a bearish divergence. MACD – histogram has a significant bearish divergence.
First support is the SPX – 200 – day Simple Moving Average (SMA), the line is also near chart support at the 05/23/25 bottom. There’s a good chance the SPX can reach this support zone during the week of 06/16/25 to 06/20/25.
