A major U.S. stock could be an important indicator for the near future.
First a look at the big picture. The daily S&P 500 (SPX) and Nasdaq 100 (NDX) chart courtesy of Trading View illustrates their relationship.

The NDX since its 04/07/25 bottom has been the leader on the upside, gaining 31.3% vs. the SPX 23.7% gain. Notice the NDX made a new rally high on 05/29/25 while the SPX failed. The Dow Jones Industrial Average also failed to make a new rally high on 05/29/25. This divergence among main U.S. stock indices is usually the prelude to at least a minor decline.
Durning the prior two trading days something different happened. NDX declined 3.1% vs. an SPX drop of 2.1%. Is the upside leader now leading to the downside? Could this be a minor anomaly, or perhaps a sign of something more ominous?
Examination of one very important stock reveals evidence of a looming bear move.
The daily Tesla Inc. (TSLA) shows amazing signals generated in the last two trading days.
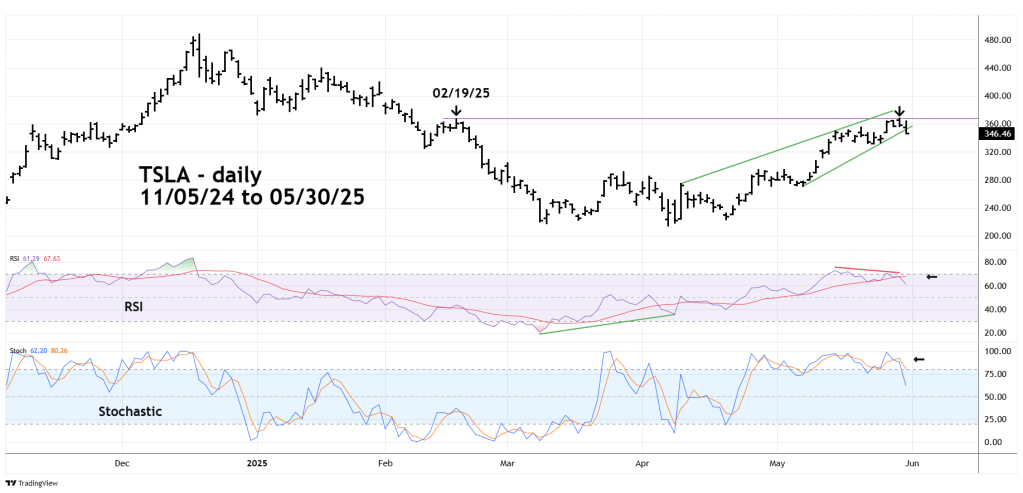
TSLA made its post 04/07/25 rally peak on 05/29/25 at almost the same level as its short-term peak on 02/19/25, the same day as the SPX all-time high.
On 05/30/25 TSLA broke below the rising trendline connecting the early May and late May bottoms.
TSLA’s late May peak had an RSI bearish divergence and then RSI crossed below its moving average line.
Stochastics had a bearish line cross in the overbought zone above 80.00.
In the coming weeks TSLA could decline 25 to 30%.
A decline of this degree could contribute to a significant NDX drop and a broad U.S. stock bear market.
