Elliott wave analysis reveals two courses the S&P 500 (SPX) could take in the coming days.
First an update on the SPX action that was illustrated in the 05/29/25 blog.
The 15 – minute SPX chart courtesy of Trading View shows what happened.

On 05/29/25 the SPX broke below its prior day bottom. Normally a break below a prior day low could be the catalyst for at least a sustained decline during the current session. In this case it did not because SPX soon bottomed very close to Fibonacci and trendline support. The 15 – minute RSI bullish divergence provided additional evidence of a potential intraday bottom.
With three bullish factors you would expect the SPX to open the 05/30/25 session up from the prior day. SPX opened the 05/30/25 session by going down. Even more amazing, it subsequently went below the powerful support at the 05/29/25 session low. With a break of strong support, you would expect a very sharp and deep decline throughout the remainder of the session.
Wrong! What happened was a strong and steady rally until the close of the session.
In this case the intraday bottom did not have trendline support.
It did not have Fibonacci support.
It did not have an RSI bullish divergence. Very peculiar.
What could happen in the next few trading days?
The first 5 – minute SPX chart examines a bullish alternate Elliott wave count.

In this scenario the SPX has completed a corrective pattern of the 05/23/25 to 05/29/25 rally. The corrective pattern is an Elliott wave – Double Zigzag. The mid portion of the pattern is an Elliott wave Inverse Horizontal Triangle.
The rally from the 05/30/25 bottom is part of, or all, a first wave up of a larger developing five wave motive structure. This presumed developing rally could exceed the SPX peak on 02/19/25.
The next 5 – minute SPX chart illustrates a bearish alternate Elliott wave count.
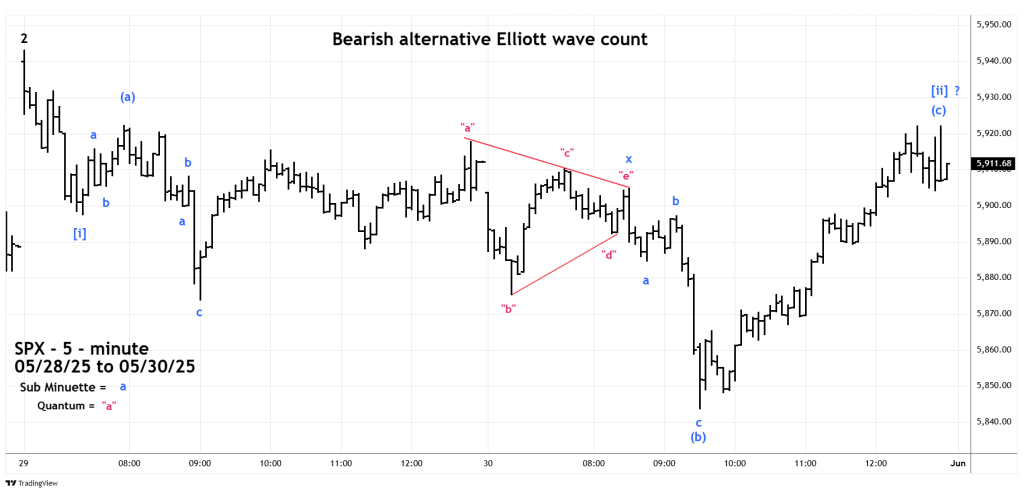
In this scenario the presumed Minute wave [i] is corrected by an Elliott wave Inverse Expanding Flat. This structure is subdivided into three sub waves. The first wave (a) further sub divides into three waves or a combination of three waves. The second wave (b) also divides into three waves or a combination of three waves. The second wave terminates beyond the point of origin of the first wave. The third wave subdivides into five waves and completes beyond the termination point of the first wave.
Please note that at the end of the 05/30/25 session the presumed Minuette wave “c” peaked slightly below the peak of Minuette wave “a.” If on 06/02/25 the SPX does not move above the Minuette wave (a) peak, the corrective structure could be an Elliott wave – Inverse Running Flat. This is a rare and potentially very bearish wave structure.
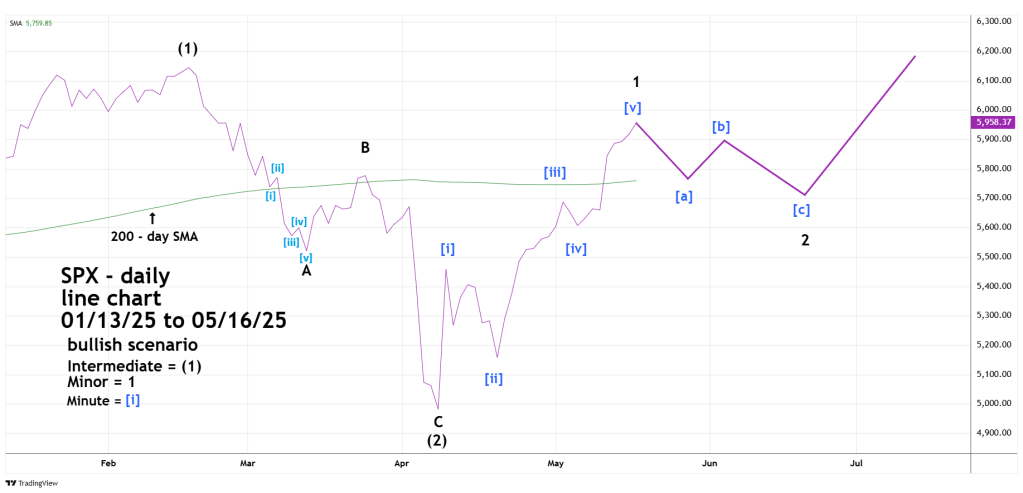
These two short – term Elliott wave patterns should be familiar; they are smaller versions of what were illustrated in the 05/18/25 blog “Bullish and Bearish S&P 500 Scenarios – 05/16/25”.
This is the daily SPX bullish scenario chart.
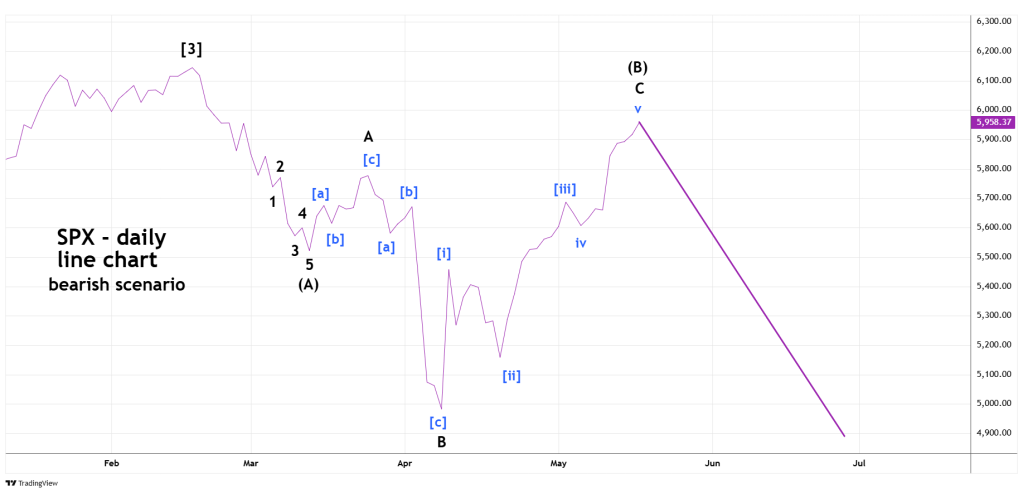
Next is the SPX bearish scenario chart.
The SPX June trading month begins on 06/02/25. Sometimes what happens on the first day of the month can determine the action for the entire month.
