A very sharp S&P 500 (SPX) decline could occur during the week of 05/27/25 to 05/30/25.
The SPX 30 – minute chart courtesy of Trading View zooms in on the intraday Elliott wave count.
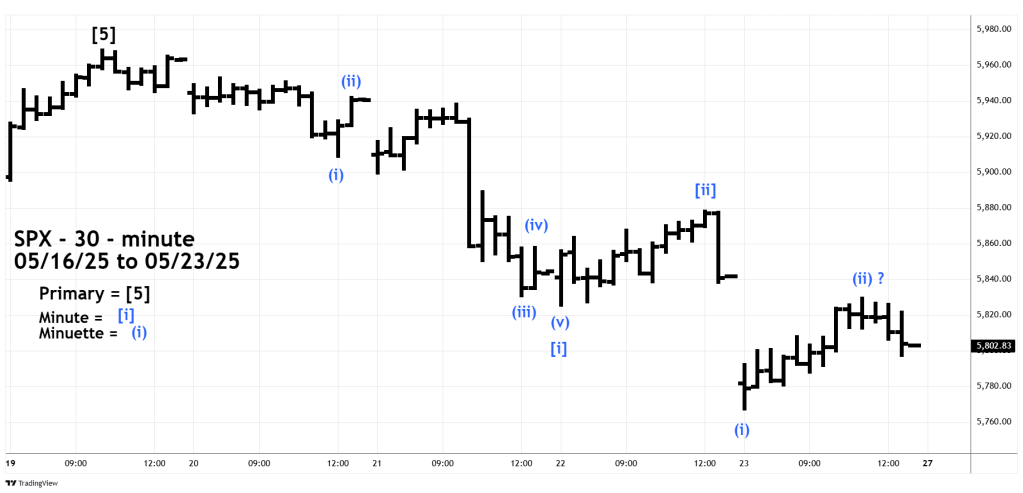
It’s possible that the SPX move down from the 05/19/25 peak is an Elliott wave series of “one’s” and “two’s” down. These structures are usually the prelude to very dynamic action.
In non-Elliott terms this is a series of lower lows and lower highs.
Please note that the presumed Minuette wave ( ii ) overlaps into the territory of Minute wave [ i ]. This overlap is common in series of “one’s” and “twos”.
Alternatively, the move down from the 05/19/25 peak could be an Elliott wave – Leading Diagonal Triangle. If this wave count is in effect, it implies a short drop down to the SPX 5,740 to 5,720 area on 05/27/25 followed by a counter trend rally of 05/19/25 to 05/27/25 decline. If this scenario develops it will be examined in a subsequent blog.
The daily SPX chart illustrates what could happen if the more bearish scenario is in effect.
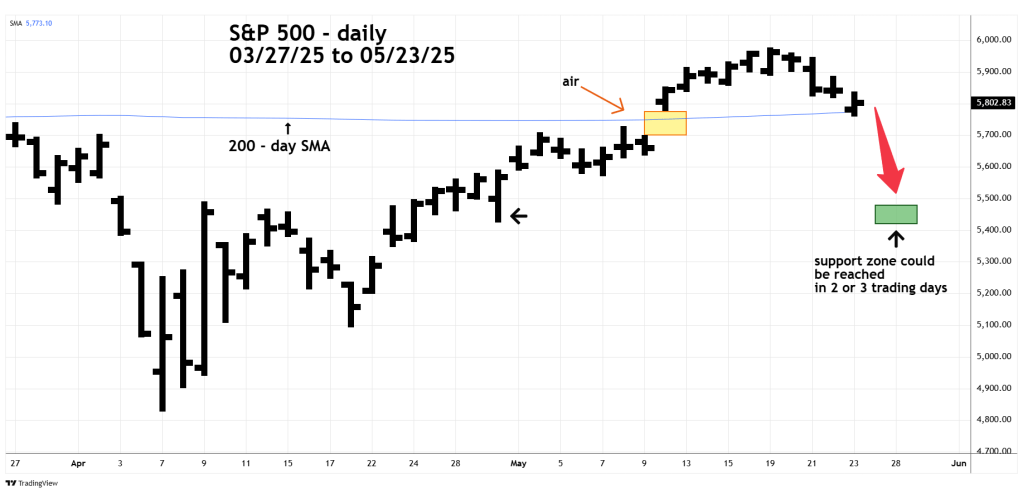
Note the “air” gap created by the powerful 05/12/25 rally. There’s probably discussion among market Technical analyst’s about filling this gap. What about another scenario? Jumping over the gap.
The SPX – 200 – day Simple Moving Average could be formidable support requiring a powerful move down to breakthrough. If so, the SPX could have a downside gap below all or part of the upside gap.
SPX could reach the low 5,400 zone in just a few trading days.
