On 05/23/25 the S&P 500 (SPX) hit and closed the trading session just above its 200 – day Simple Moving Average (SMA). What the SPX does during the week of 05/27/25 to 05/30/25 could determine its course into at least mid – July 2025.
The daily SPX chart courtesy of Trading View illustrates what’s happened.
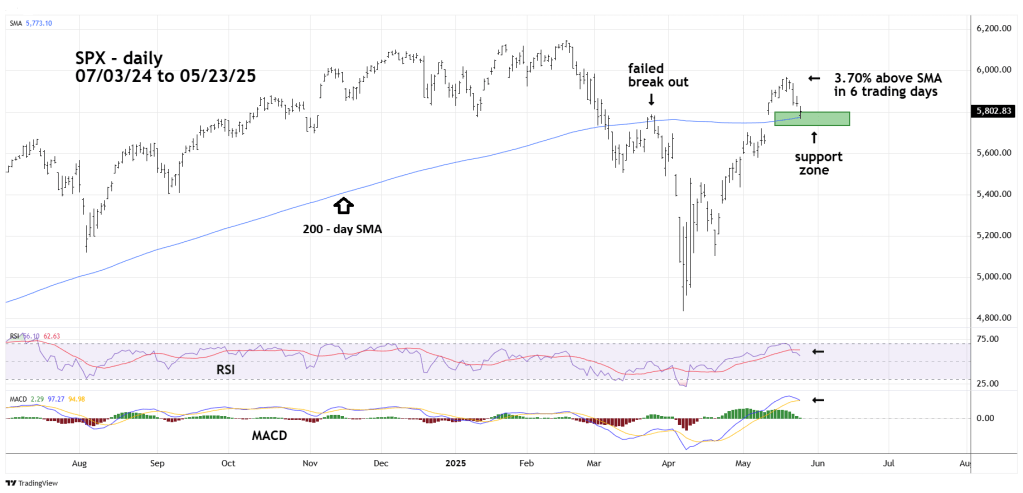
In late March 2025 the SPX rallied marginally above the 200 – day SMA. Bears defended the line; the SPX subsequently declined16% below the SMA. The SPX mid – May 3.7% move above the 200 – day SMA could be decisive. It’s possible the bulls will use the current move back to the area around the 200 – day SMA as a reason to buy.
Please note the positions of the daily RSI and MACD. RSI after peaking just below its overbought zone has now moved below its moving average line. MACD lines are on the verge of a bearish line cross.
The SPX had a similar situation during its 2022 bear market. The daily SPX chart from 2022 shows the action during the ten – month bear trend.

In late March 2022 the SPX rallied 3.6% above the 200 – day SMA. Note the position of RSI after the SPX returned to the area around the SMA line. RSI, which peaked below its overbought zone later moved below its moving average line. Daily MACD lines were on the verge of a bearish cross.
Subsequently the SPX broke decisively below the line and in the next 30 – trading days declined 15%.
If the SPX repeats this action in 2025 it could return to the area of the 04/07/25 bottom sometime in early or mid – July 2025.
