On 05/22/25 the CBOE 30 – Year Treasury Bond Yield (TYX) hit 5.15 the high of a multi – year bull move made on 10/23/23.
The daily TYX chart courtesy of Trading View illustrates the most likely Ellott wave count.
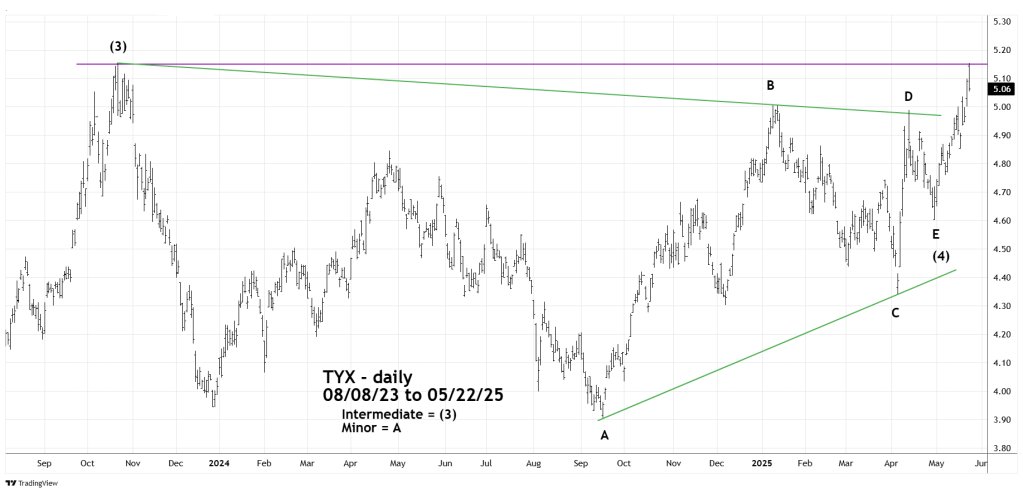
The 05/17/25 blog “Detailed Elliott Wave Count for U.S. 30 – Year Treasury Yield -05/16/25” illustrated that TYX may have completed an Elliott Wave – Horizontal Triangle from 10/23/23 to 04/30/25. If so the current TYX rise could be a post triangle trust up to the 6.00 area.
There are always alternate Elliott wave counts. Perhaps TYX peak today 05/22/25 at the exact high made on 10/23/23 is a double top of some other Elliott wave count.
Momentum evidence could hold clues to near- term TYX action.
The daily TYX chart courtesy of BigCharts.com shows daily momentum oscillators.
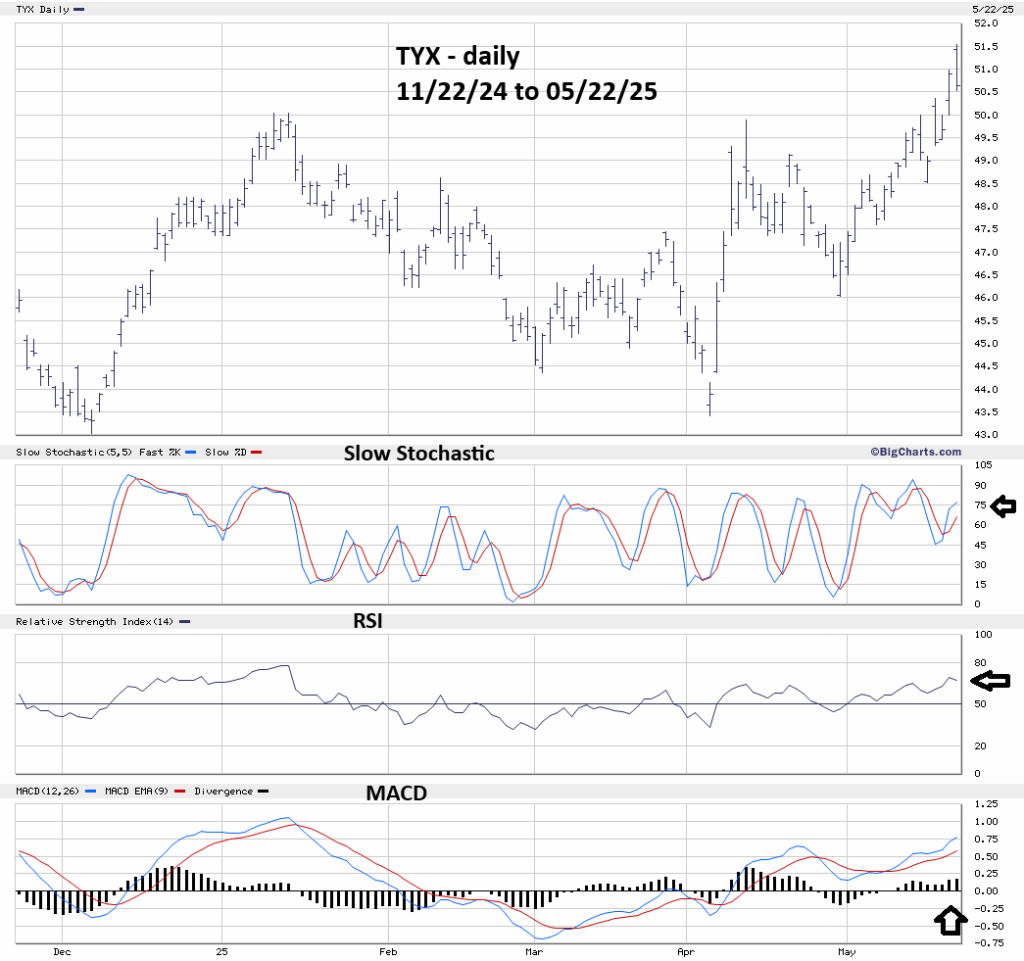
The BigCharts.com Slow Stochastic is very effective in discovering market turns. Both lines are below the overbought zone which begins at 80.00.
Daily RSI is also below its overbought zone that begins at 70.00.
MACD is still rising from its short – term bottom made in late April 2025. Momentum oscillators imply more upside action.
If TYX can break above 5.15 in the next few trading days, there’s a good chance of reaching the 6.00 area later in 2025.
