Daily S&P 500 (SPX) Stochastic has a bearish line cross. Daily RSI has crossed below its moving average line.
The daily SPX chart courtesy of Trading View updates the action.
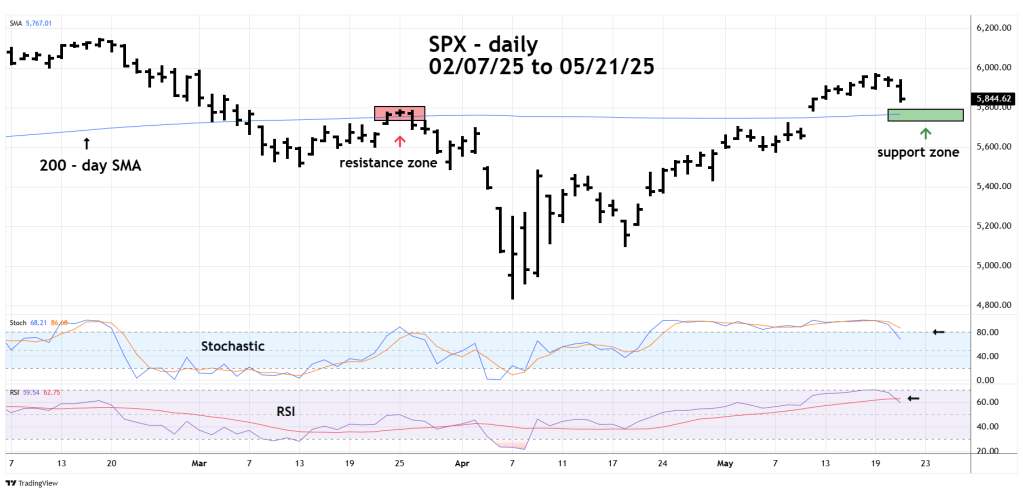
If the SPX decisively moves below its 200 – day Simple Moving Average (SMA) and stays below the line, it could be very bearish.
How bearish? It’s possible the SPX could retrace at least to the 04/07/25 bottom.
Watch the SPX – 200 – day SMA!
