Trendline analysis could identify the next significant S&P 500 (SPX) turn.
The two – hour SPX chart courtesy of Trading View updates the action.
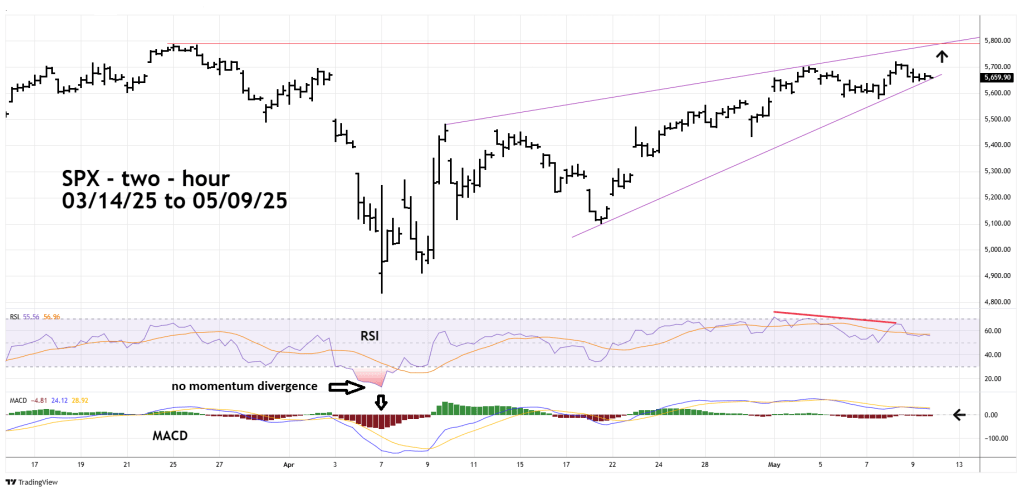
Since 04/09/25 the SPX has been trading within a rising wedge which is typically bearish. The upper trendline intersects with the 03/25/25 peak on 05/12/25.
Note that the two – hour RSI had bearish divergences at 05/08/25 peak. MACD lines have bearish divergences, and the Histogram has been trending down since 04/09/25. Momentum of the post 04/07/25 rally is weakening.
Also note that the SPX 04/07/25 bottom was made on maximum downside momentum for both RSI and MACD. Most of the time significant stock market bottoms are made with at least one bullish momentum divergence. The maximum momentum readings on 04/07/25 imply the SPX could go below the 04/07/25 bottom sometime in the next several weeks.
If the SPX continues to rise a bear market rally peak could terminate on 05/12/25 or 05/13/25.
