The prior blog “S&P 500 Rallies into the Heart of Resistance – 05/01/25” noted.
“The 04/27/25 blog “Short-Term Outlook for U.S. Stocks – 04/25/25” illustrated that during the 2022 bear market SPX stocks above the 20 – day moving average during the March and August bear market rallies had readings above 90. The reading on 05/01/25 was 82.60. This could mean the SPX rally has further to go, or the current SPX strength is weaker than the 2022 bear market”.
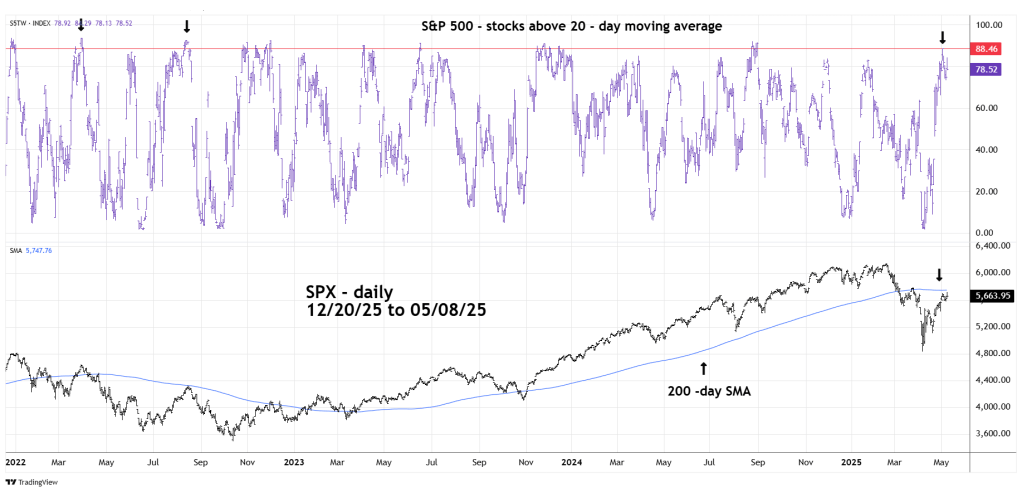
The daily S&P 500 (SPX) chart courtesy of Trading View updates the action.
The SPX rally did have further to go as it has made a new post 04/07/25 rally high.
On 05/02/25 S&P 500 stocks above the 20-day moving average (S5TW) reached the area of 88, in the 2022 SPX bear market rally S5TW hit the 93 area. Based on this indicator the S&P 500 could continue higher.
Please note the SPX is nearing its 200 – day Simple Moving Average (SMA). A move of more than two trading days above the 200 – day SMA could signal a rally back to the February 2025 high.
