U.S. stocks could continue to rally into the week of 04/28/25 to 05/02/25.
The daily S&P 500 (SPX) chart courtesy of BigCharts.com illustrates the recent action.

As of 04/25/25 only the upper line of the Slow Stochastic has reached the overbought zone which begins at 80.00. The lower line is at about 70.00. The reading implies at least a few more days of rally before a peak could be made.
The Trading View- SPX daily chart with an index of S&P 500 stocks above 20 – day moving average (S5TW) compares action in 2025 with the 2022 bear market.

The S5TW reading on 04/25/25 was 71.65. Please note that in the two largest bear market rallies of 2022 – S5TW had readings above 90.00. If the SPX – 2025 decline is another choppy bear market like 2022, there could be additional upside action before the bear trend resumes.
The daily S&P 500 – June 2025 – E-mini futures chart (ESM2025) examines what could happen on 04/28/25.
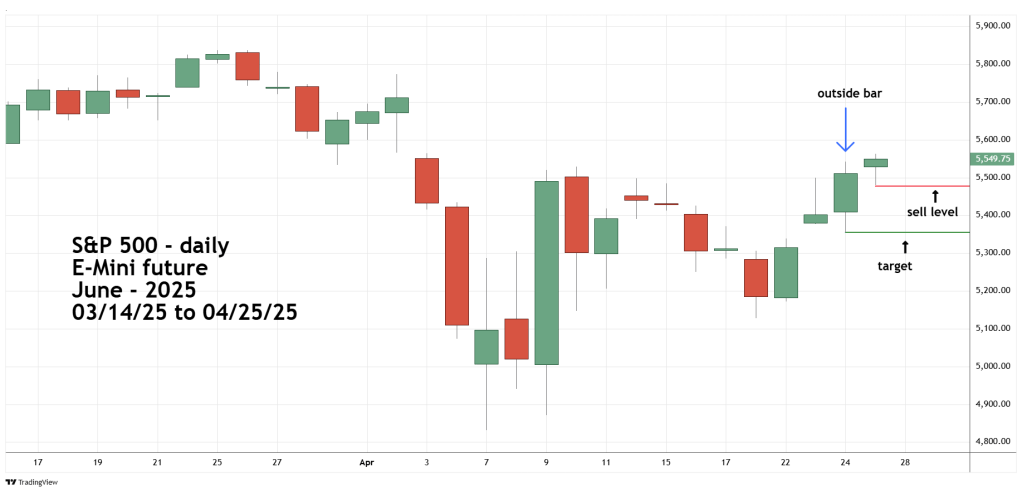
This chart illustrates a potential STRAT method sell signal. The STRAT method is more effective using futures charts because they encompass more trading hours.
The 04/19/25 blog “Near-Term Gold Shorting Opportunity – 04/17/25” illustrated a potential Gold decline based on a STRAT setup. This was on a weekly scale in which Gold futures during the first week of April had an outside bar followed by a marginally higher bar.
The same phenomenon has happened on a daily scale for ESM2025. On 04/24/25 there was an outside bar. On 04/25/25 there was a marginally higher bar. If ES2025 does not move above the 04/25/25 high and goes below the 04/25/25 low, it could trigger more selling.
The downside target is the 04/24/25 low. If this scenario plays out, the decline could be completed on 04/28/25.
