The S&P 500 (SPX) has reached the edge of overhead resistance.
The SPX has a trading range from 5,500 to 5,700 made in March 2025. Traders/investors that went long stocks in this zone quickly experience a sharp market decline. This is overhead resistance where many stock buyers could sell rising stocks.
The daily SPX chart courtesy of BigCharts.com illustrates what’s happening.
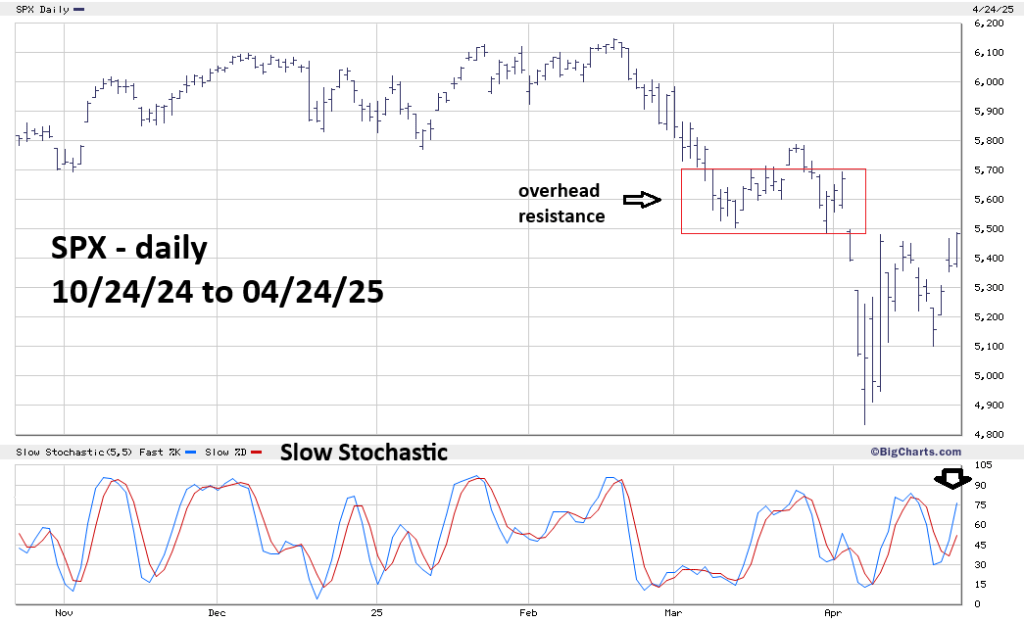
The BigCharts.com very effective Slow Stochastic implies more upside action for at least the next few trading days.
If the SPX gets into the overhead resistance zone, selling from trapped bulls could slow down the speed of the rally after 04/07/25. Velocity is the word to describe post 04/07/25 action.
On 04/09/25 the SPX moved up 560 points!
On 04/23/25 the SPX had a 107-point opening session gap!
In the first hour of the SPX 04/23/25 session there was a one – minute – 43 – point rally!
During stock bull markets, gains are usually steady and moderate.
Stock bear market rallies are typically fast and furious fueled by hope that the bull market has returned. The rapid rallies are usually not sustained, leading to a return of the downtrend.
