For several months Gold prices have pushed higher and could continue higher in 2025. However, near-term conditions present an opportunity for aggressive traders to short Gold.
The weekly Gold futures chart courtesy of Barchart.com updates Gold sentiment.
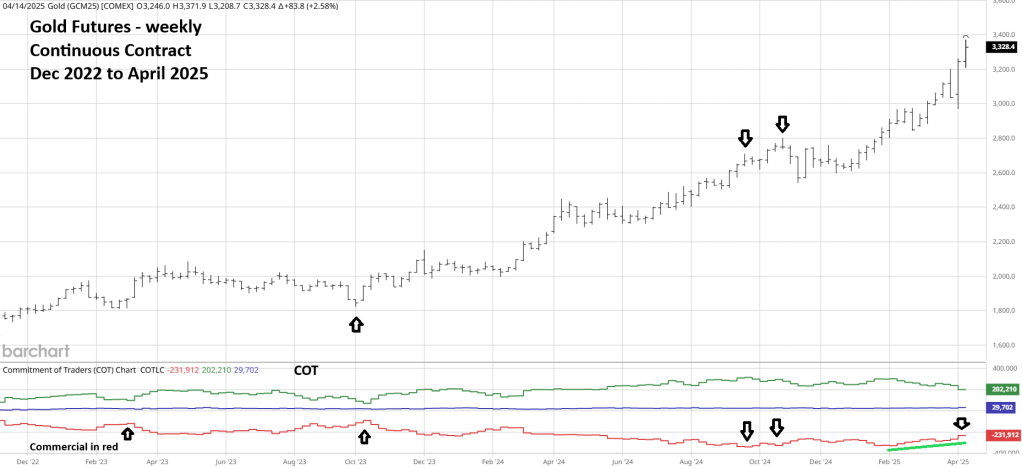
Each week the Commitment of Traders (COT) report tracks the net contract positions for various Futures. There are three main groups, Small Speculators, Large Speculators and Commercials. The Commercials are the group to follow because they have the most knowledge of the Futures they’re trading.
Gold Commercials are almost always net short because the need to hedge against potential Gold price declines. Note that at October 2023 Gold bottom Commercials had a small net short position. Later, in October and November 2024 at Gold peaks Commercial had a high level of short positions. This condition was noted in several blogs on this website.
Subsequently Gold declined, however it was shallow and the 01/12/25 blog “A Golden Triangle?” illustrated that an Elliott – wave – Horizontal Triangle may have completed, and a new rally could be underway. Which is what happened.
The fascinating aspect of the 2025 Gold rally is that Commercials have been decreasing their net short positions! If there is a near – term peak for Gold, the Commercials anticipate higher prices later in 2025.
The weekly Gold Futures (GC1!) chart courtesy of Trading View updates the long-term Elliott wave count.
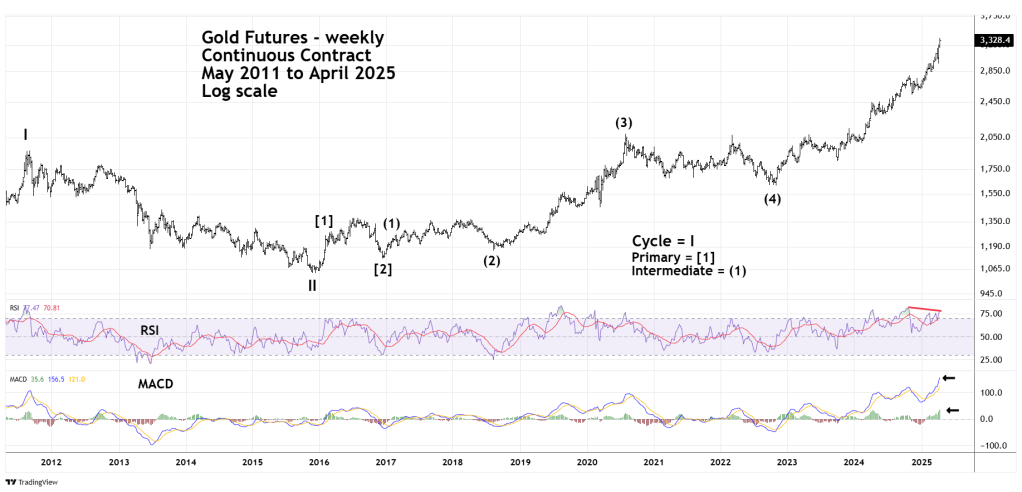
Gold currently appears to be in Intermediate wave (5) of Primary wave [3]. Weekly RSI has a bearish divergence while MACD – lines and Histogram are at the highest levels since the bull move began in October 2022. Usually at significant price peaks both RSI and MACD have bearish divergences. The current mixed signals imply Gold could be in the process of forming only a short-term peak.
The daily Gold Futures chart focuses on the bull move that began in October 2022.
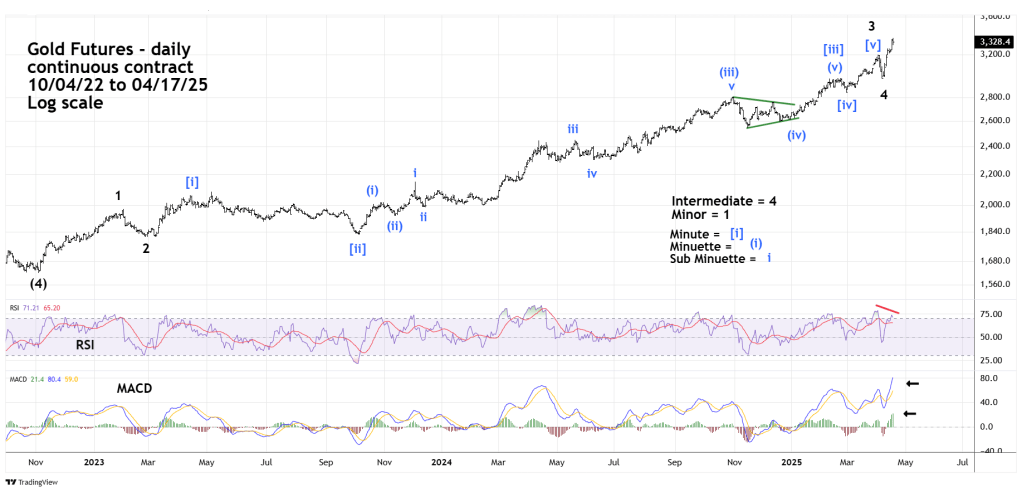
This Elliott wave count is one of several alternate counts. It’s possible Intermediate wave (5) of Primary wave [3] is nearing a termination point. However, there are many subdivisions within the bull market that began in October 2022. A near – term top could be followed by a decline of a few weeks, then a continuation of Intermediate wave (5) of Primary wave [3].
Daily momentum readings are like the weekly readings. Daily RSI has a bearish divergence while MACD has no divergence. This implies only a short-term peak.
If a short-term peak develops, the STRAT method identifies a potential level to short Gold.
The weekly Gold – Candle chart illustrates a potential STRAT shorting strategy.
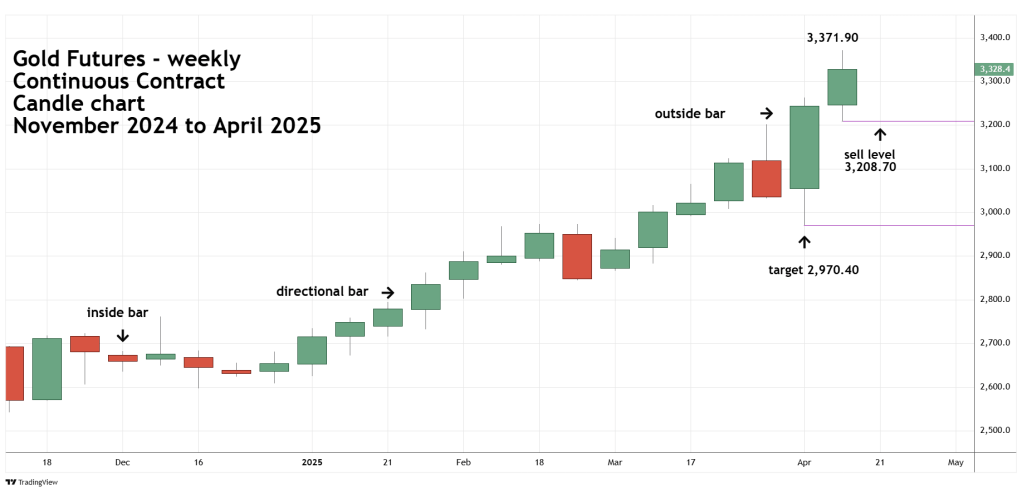
At its core, the STRAT strategy categories price behavior into three scenarios—inside bars (1), directional bars (2), and outside bars (3).
An inside bar is within the body of the prior bar.
Directional bars start within the body of the prior bar and move either above or below the prior bar.
Outside bars engulf the prior bar.
The occurrence of outside bars is rare especially if they happen after significant rallies or declines. An outside bar after a significant move is a great scenario for at least a short – term turn.
The week of 04/07/25 to 04/11/25 was an outside bar. The next week 04/14/25 to 04/17/25 was a directional bar. If during next week 04/21/25 to 04/25/25 Gold does not exceed the peak of the prior week at 3,371.90 and goes below the prior week low at 3,208.70 it’s a short selling signal.
If next week Gold exceeds 3,371.90 and does not go below 3,208.70 the sell strategy is invalidated.
If next week Gold stays within the body of the prior week action, the strategy is on hold until Gold moves below 3,208.70 without a prior move above 3,371.90.
If next week Gold stays below 3,371.90 and breaks below 3,208.70 it could reach the downside target of 2,970.40 in one or two weeks.
The STRAT method can be used on any time scale, from yearly bars to one- minute bars.
