The daily VIX chart courtesy of Trading View illustrates long term sentiment.

The VIX, which is also referred to as the fear index, is very effective identifying S&P 500 (SPX) bottoms. VIX spikes up correspond to SPX spikes down. The big question, how high do the VIX spikes go before the SPX bottoms?
The RSI provides a guide to discover VIX peaks. Daily RSI moves into the overbought zone above 70.00 indicate a VIX peak could be nearby.
Another factor to consider is that sometimes VIX peaks do not exactly correspond to SPX bottoms. The SPX 08/05/24 mini crash bottom was on the same day as the SPX spike.
However, the Covid crash VIX peak was on 03/18/20, the SPX 2020 crash bottom was on 03/23/20. Assuming the SPX low on 04/04/25 was not an intermediate bottom, current VIX readings imply an important SPX bottom could be made in one or two weeks.
Daily Put/Call ratio – Trading View symbol (PC) provides additional sentiment information.
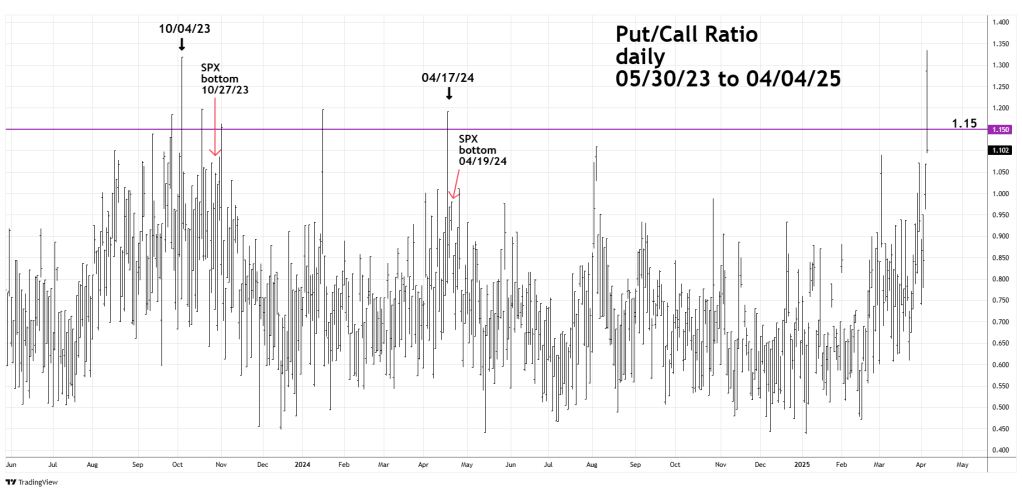
Investors Business Daily uses a PC level of 1.15 as an indication that a stock market bottom could be forming.
On 04/04/25 – PC went over 1.15. Just like VIX the PC can also have sentiment divergences. This phenomenon occurred in October 2023 and in April 2024. If an important SPX bottom is not already in place, the relationship between SPX and PC could soon provide valuable information.
The NYSE – 52 – Week lows chart courtesy of Barchart.com reveals some incredible data.
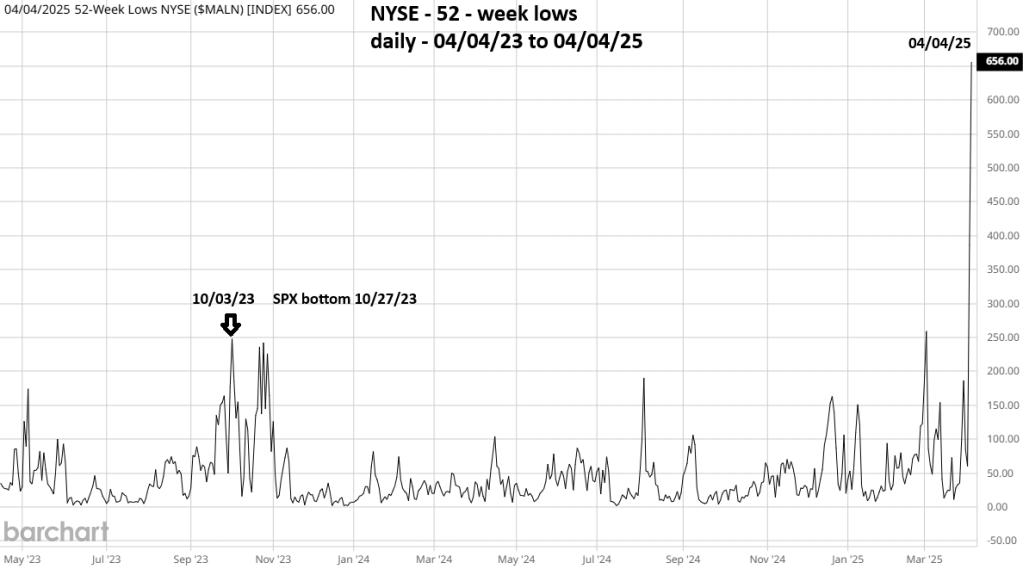
The number of NYSE lows on 04/04/25 was 656 far exceeding the maximum lows of 248 reached on 10/03/23. The SPX intermediate bottom was on 10/27/23.
The maximum number of new lows just prior to the SPX major bottom on 10/13/22 was 587 made on 09/23/22.
The maximum new lows in the Covid crash were 1,349 made on 03/12/20. SPX crash bottom was 03/23/20.
Note that on each instance the maximum lows occurred before the SPX ultimate bottom. If the new lows reading on 04/04/25 is the maximum, the final SPX bottom could be made in one to three weeks.
The current new lows reading is the highest in five years and opens the possibility that something larger than an intermediate decline is developing.
Perhaps an SPX two month 20% plus decline is occurring. We could have an answer in the next one to two weeks.
Traders are holding short 100% Russell 2000 non – leveraged funds from the Russell 2000 opening session on 01/23/25. Continue holding short.
