The S&P 500 (SPX) rallied most of the 04/02/25 session in anticipation of U.S. President Trump’s tariff speech just after 4:00 PM – EDT. Minutes after the speech began the S&P 500 – Futures went into a huge decline that soon wiped out all the SPX 04/02/25 gains. What were the bulls thinking prior to 4:00 PM – EDT?
The daily SPX chart courtesy of BigCharts.com updates the big picture.
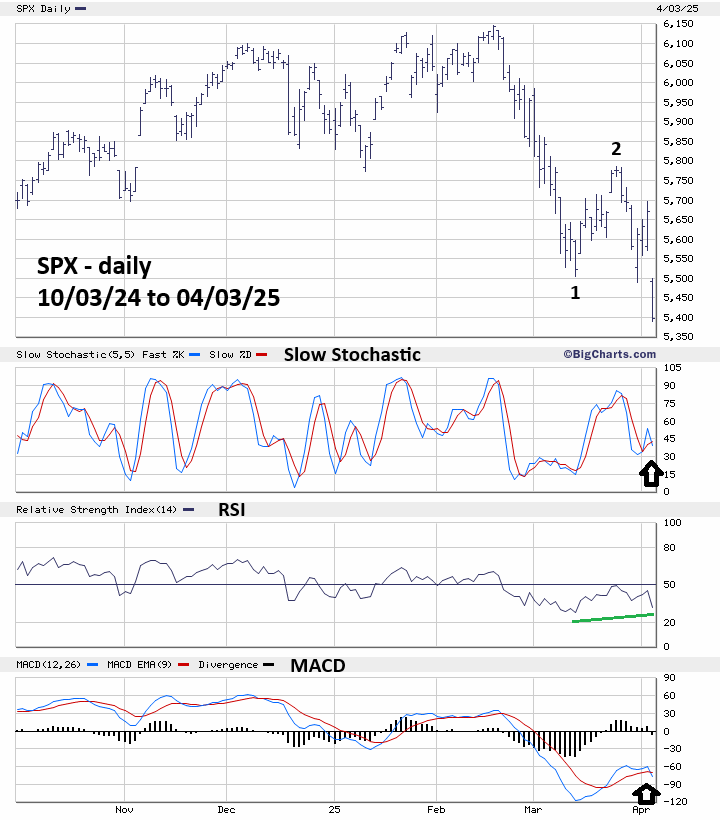
Daily RSI has a bullish divergence. However, both Slow Stochastic and MACD have bearish line crosses. The weight of evidence from the three oscillators is bearish.
The 15 – minute chart examines the intraday action.

The Elliott wave count from the 04/02/25 peak appears to be a complete or nearly complete Impulse wave down.
Slow stochastic, RSI, and MACD all have bullish divergences.
There’s a good chance on 04/04/25for a SPX short – term bounce.
Daily momentum and the Elliott wave count suggest U.S. stocks could be amid a very large decline.
This website’s next blog will examine what could happen in the next two – weeks.
