The daily S&P 500 (SPX) chart courtesy of BigCharts.com updates the action.
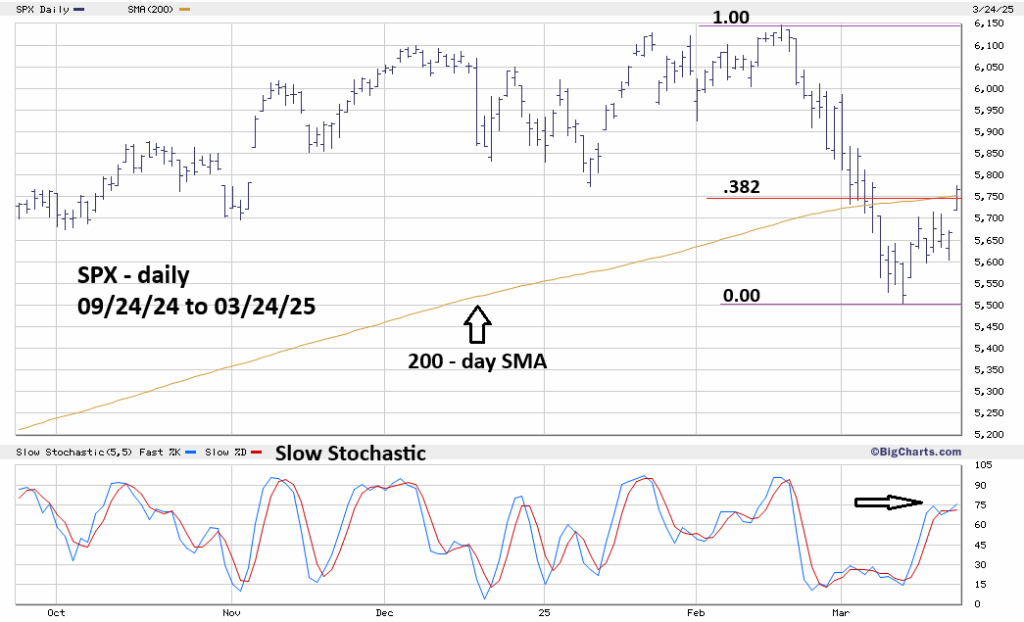
On 03/24/25 the SPX moved above the Fibonacci .382 retracement level of the February to March 2025 decline and the 200 – day Simple Moving Average (SMA). Of the two the widely followed 200- day SMA is more important.
If SPX continues to rally decisively above the 200-day SMA it could signal a move up to the 5,950 area. If within the next few trading days SPX moves back below the 200 – day SMA it could be a very bearish signal.
The very effective BigCharts.com – Slow Stochastic indicator has still not reached the overbought zone above 80.00 and implies at more upside action.
The intraday SPX – Elliott wave count is becoming clearer. SPX looks like it could soon have a multi – hour decline followed by a multi- hour rally to new post 03/13/25 rally highs.
SPX could make an important peak in one to three trading days.
