Short-term momentum and price evidence suggests stocks could rally into the U.S. – FOMC interest rate announcement on 03/19/25.
The hourly S&P 500 (SPX) chart courtesy of Trading View illustrates the short-term action.
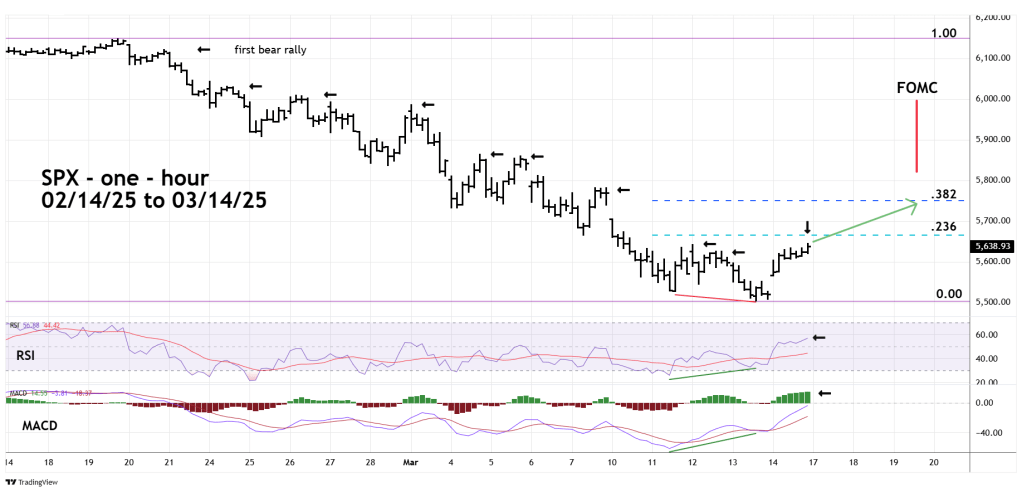
On 03/13/25 SPX bottomed out just above round number support at 5,500. Hourly RSI and MACD had significant bullish divergences. At the end of the SPX 03/14/25 trading session MACD – Histogram was still rising, and RSI has yet to reach the overbought zone above 70.00. Both oscillators imply higher prices in the next few trading days.
There’s also important evidence from the Price dimension.
Note that since the SPX all-time high on 02/19/25 none of the rallies lasting longer than three – hours have been exceeded by the subsequent rally. A series of declining peaks.
During the SPX 03/14/25 session – something different happened.
Note that at mid-session SPX exceeded the peak made on 03/12/25. Late in the session SPX exceeded the peak made on 03/11/25.
Momentum and price evidence strongly imply a rally for at least a few trading days. If the SPX can break above .236 Fibonacci resistance it could open the door for a move up to the .382 Fibonacci area.
The U.S. FOMC meets 03/18/25 to 03/19/25 with an interest rate announcement at 1:00 PM – EDT 03/19/25.
Markets tend to trend into significant events, and for several years the FOMC meetings have been the most significant. The reaction of U.S. stocks after the announcement could affect their direction for at least a few weeks. A sustained rally could propel the SPX up to Fibonacci .618 resistance near 5,900. A decline could mean the SPX falls to the August 2024 mini-crash bottom near 5,100.
