The 02/22/25 blog “Short-Term S&P 500 Downside Target” noted that a break below S&P 500 (SPX) 6,003.00 could open the door for a move down to the 5,700 area.
The daily SPX chart courtesy of Trading View updates the action.
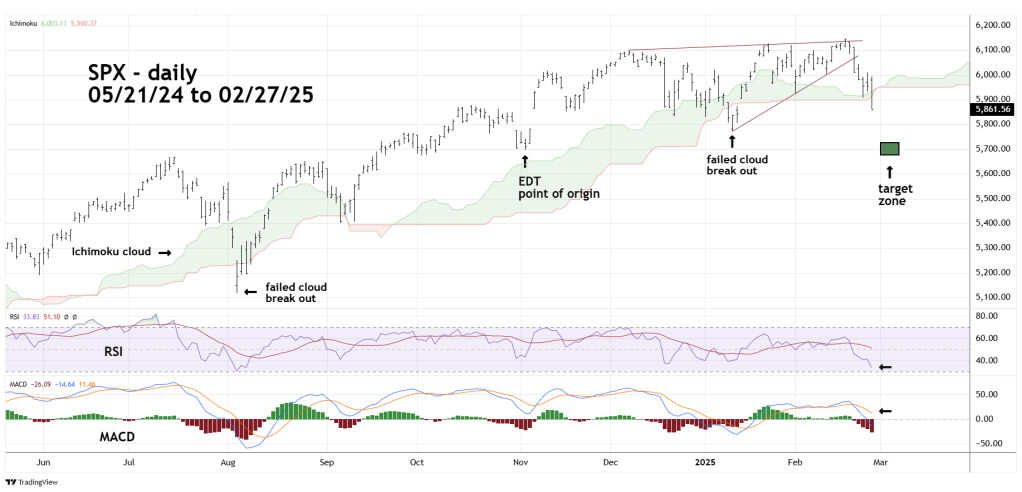
The important support at 6,003.00 was broken and the SPX is in a steep decline.
Daily RSI has yet to reach the oversold zone which begins at 30.00.
Only one line of MACD has gone below the “zero” level. Both indicators imply more downside action.
A big test for the bears is to keep the SPX below the Ichimoku cloud. Note the prior two downside breaks failed.
If the SPX can find support in the low 5,700 area, a bottom could be made in the 03/03/25 to 03/07/25 time zone.
