On 02/19/25 the S&P 500 (SPX) made a new all – time high unaccompanied by the other two main U.S. stock indices – Dow Jones Industrial Average and the Nasdaq Composite. This bearish divergence occurred on a fascinating Day.
The weekly SPX courtesy of Trading View illustrates what happened.

The SPX late session high on 02/19/25 occurred exactly five – years after the pre Covid crash peak on 02/19/20.
There is precedent for the SPX movement in this Fibonacci – time segment. The SPX bull market that began on 10/10/02 ended on 10/11/07.
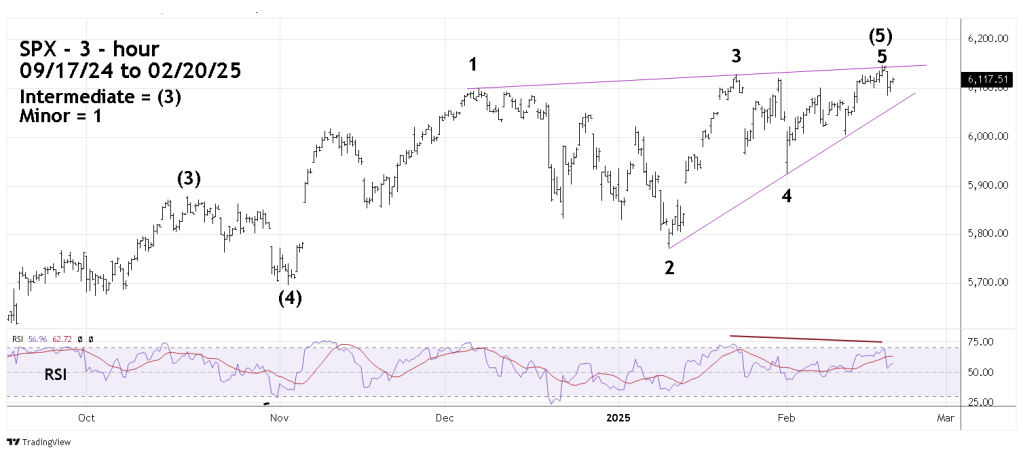
The SPX – 3 – hour chart shows an interesting alternate Elliott wave count.
The 02/15/25 blog “Updated S&P 500- Long – Term Elliott Wave Count – 02/14/25” illustrated that the SPX may have formed a Horizontal Triangle from December 2024 to February 2025. The most recent rally from 02/12/25 could be a post triangle thrust up.
The 3 – hour SPX chart shows an alternate count in which the SPX may have formed an Elliott wave – Ending Diagonal Triangle from 11/04/24 to 02/19/25. After an Ending Diagonal Triangle is complete, there’s usually a rapid retracement back to the triangles point of origin. In this case it’s the 11/04/24 bottom near 5,700.
The SPX could reach 5,700 sometime in the first week of March 2025.
