The prior blog “Updated S&P 500 – Long -Term Elliott Wave Count -02/14/25” noted that the S&P 500 (SPX) October to December 2022 rally – Intermediate wave (1) had a growth rate of 17.4%. There’s usually a Fibonacci price relationship between the first and fifth waves of motive patterns.
Assuming that the SPX 01/13/25 bottom at 5,773.31 is the low point of Intermediate wave (4), its possible to calculate the termination point of Intermediate wave (5) and the climax of the bull market since October 2022.
Multiplying the growth rate of Intermediate wave (1) of 17.4% by the Fibonacci ratio of .382 equals a growth rate of 6.6%, adding this to the presumed Intermediate wave (4) bottom of 5,773.31 targets 6,154.35 as the intermediate wave (5) termination point.
The SPX all-time high made on 01/24/25 was 6,128.18. You may be thinking a target top only 26.17 points above the prior high is too small of a move. This could be correct, except the momentum for the SPX in February 2025 is extremely bearish.
The SPX daily chart courtesy of Trading View illustrates important reference points.

The two important peaks occurred on 12/06/24 and 01/24/25. Note the rising trendline will soon be crossing near the Fibonacci target of 6,154.35.
The lower rising trendline connects the bottoms made on 01/13/25, 02/03/25, and 02/12/25. A break below the lower trendline could be the first bearish warning. A break below support at 6,003.00 could very important.
The next chart courtesy of StockCharts.com shows the SPX cumulative Advance/Decline line.

The maximum A/D point occurred on 11/29/24 a few trading days before the SPX penultimate peak made on 12/06/24. A secondary A/D peak happened on 01/30/25 a few trading days after the so far ultimate SPX peak. Note the considerable difference between the two A/D peaks. The most recent A/D peak with the SPX close to its all-time high is lower than the secondary A/D peak.
The next chart courtesy of Barchart.com illustrates NYSE 52 – week new highs.

Maximum strength occurred on 11/06/24 a month before the SPX first peak. On 11/25/24 there was a bearish divergence. On 12/05/24 just before the SPX 12/06/24 peak there was a massive bearish divergence. On 01/30/25 just after the SPX 01/24/25 peak, new highs had marginal increase over the 12/05/24 reading.
However, on 02/14/25 new highs were below the 01/30/25 reading and below the level recorded on 12/05/24.
The final chart from StockCharts.com shows the S&P 500 Bullish Percent Index – symbol ($BPSPX).
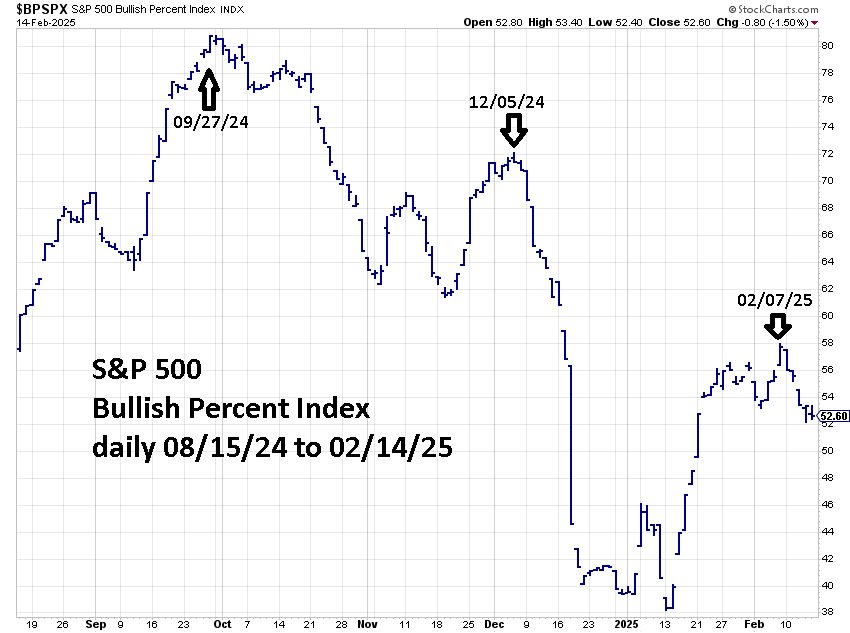
A Bullish Percent Index is a breadth indicator based on the number of stocks on Point & Figure Buy Signals within an index.
This is a broad-based tool and does not give precise turning points. In a period of six to twelve months there could be several divergences before a market turn happens.
Maximum strength for $BPSPX happened months before the SPX 12/06/24 peak. At the time of the SPX 12/06/24 peak $BSPX had a significant bearish divergence. On 02/07/25 with the SPX almost at the same level made on 12/06/24, $BPSPX had a bearish divergence vs. the 12/05/24 reading. On 02/14/25 with the SPX slightly higher than on 02/07/25 $BPSPX was trending DOWN!
The momentum for U.S. stocks, and in particular the SPX is very bearish. If you think of momentum as fuel for a market, current readings imply there is not much strength remaining for upside action. Therefore, if SPX can continue to rally it could be small and brief, perhaps one to three trading days.
February peaks are rare for U.S. stocks, the last significant peak happened on 02/19/20 just before the Covid panic crash.

Overwhelming bearish setup.
Perhaps .Citibank Panic/Greed Indicator was last at 70, Pure unadoltrated top. Greed.Manic Top
My hunch is that the Trump trade,LONG “bullish”
is going to continue much further into the 2020’s than expected
.
The Indicators presented in chart form could be forming a “cup and handle pattern.
If correct in interpretation allowing them to ultimately play catch up, and “lead” the SPX to 7000.
LikeLike
Thanks for the comment.
LikeLike