The 01/12/25 blog “A Golden Triangle?” speculated that Gold was forming an Elliott Wave – Horizontal Triangle that could be the prelude to new highs.
The daily Gold Futures Continuous Contract (GC1!) chart courtesy of Trading View updates the action.
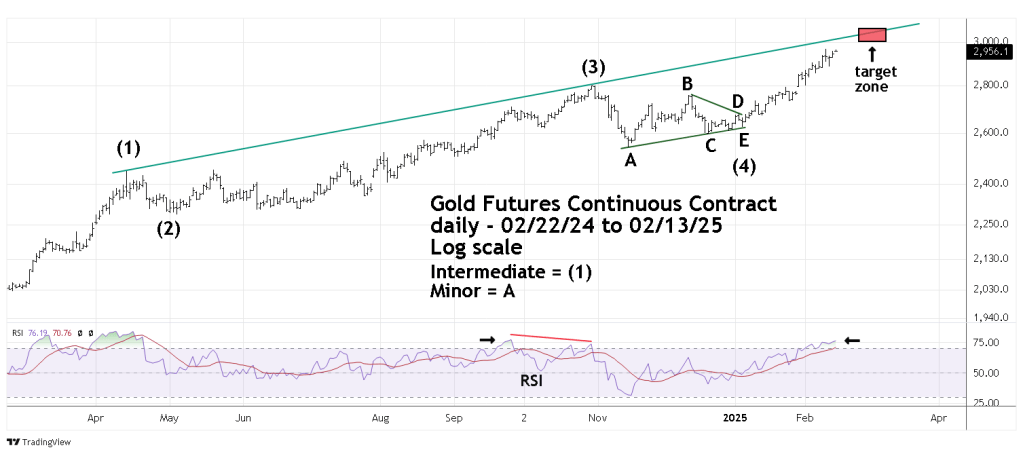
It appears a Horizontal Triangle has completed, and Gold is in a post triangle thrust up. There’s usually a Fibonacci price relationship with the widest part of a Horizontal Triangle and the subsequent movement after the termination point of the triangle.
In this case the widest part of the Horizontal Triangle is Minor wave “A” which is 260.30 points.
Multiplying 260.30 by the Fibonacci inverse ratio of 1.618 is 421.20 points,
The presumed termination point of the Horizontal Triangle is the Minor wave “E” bottom at 2,624.60 adding 421.20 targets 3,045.80 as a bullseye target for Intermediate wave (5).
This price target is in the area of the rising trendline connecting the Intermediate wave (1) and Intermediate wave (3) peaks.
On 02/13/24 daily RSI reached its highest level since the bottom made on 11/14/24. Frequently prices will peak with at least one RSI bearish divergence. Please note the bearish RSI divergence made in October 2024 vs. the September 2024 peak.
There’s a good chance Gold could make an intermediate degree peak sometime late February or early March 2025.
