The 01/11/25 blog “U.S. Stock Market Short- Term Rise Complete?” noted.
“If on 01/13/25 the SPX declines more than 1.50% from its session close of 01/10/25 , it could be just the start of a very steep decline.
Otherwise, be prepared for another U.S. stock market rally”.
On 01/13/24 the SPX declined less than 1.50%, subsequently there was another strong rally.
The hourly S&P 500 (SPX) chart courtesy of Trading View illustrates what could be very important support and resistance levels.
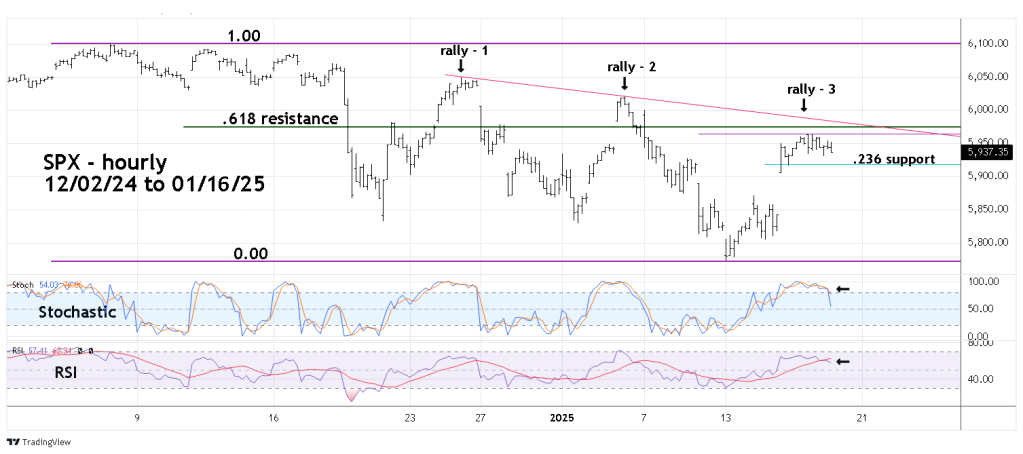
If the SPX rallies on 01/17/25 watch the declining trendline connecting the 12/26/24 and 01/06/25 peaks labeled respectively, rally – 1 and rally – 2.
Nearby the declining trendline are two potential Fibonacci resistance points. The first is a Fibonacci .618 retracement of the SPX 12/06/24 to 01/13/25 decline at 5,975.18.
Another potential resistance level is the relationship of rally – 2 to rally – 3. Rally – 2 from 01/02/25 to 01/06/25 was 191.51 points.
Rally – 3 from 01/13/25 to 01/16/25 was 191.38 points almost an exact Fibonacci ratio of 1/1 – equality. The SPX high on 01/16/25 was 5,964.69, just above is the primary Fibonacci point of 5,975.18, and nearby is the declining trendline. A decisive move above this formidable triple resistance could be just the start of another powerful rally.
On the downside watch for a move below the Fibonacci .236 retracement level of 01/13/25 to 01/16/25 rally at 5,918.79. Just below this point is the 01/15/25 correction low at 5,916.28.
Supporting the theory for a break below 5,916.28 is evidence from hourly momentum. Stochastic has a bearish lines cross, and RSI has moved below its hourly moving average line.
The one – minute S&P 500 – E -Mini futures Point & Figure chart courtesy of Ninja Trader shows additional bearish evidence.

Point & Figure charts focus on price action, rallies are illustrated by X’s declines by O’s. This chart is supplemented by the Volume Profile indicator. The widest part of the profile represent the strongest potential support/resistance area which is called Point of Control (POC).
Note that late in the 01/16/25 session price moved decisively below the POC. This could be a bearish omen for trading on 01/17/25. There’s a double bottom made on the 01/15/25 session. If there’s a decisive break below this level it could trigger a powerful move down to the low 5,900 area. There’s nothing but air – no volume or chart support to halt a drop.
Price action of the SPX and S&P 500- E -Mini futures could trigger decisive moves either up or down.
The principles illustrated in this blog can be applied to discover support/resistance levels for any market on any time frame.
