Gold in U.S. dollars since the late October 2024 peak appears to be forming an Elliott wave – Horizontal Triangle.
Elliott wave – Horizontal Triangles are corrective formations composed of five sub waves. Each sub wave further subdivide into three wave or a combination of three wave patterns. They are net sideways movements and form between converging trendlines. After completion of a Horizontal Triangle there’s usually a thrust in the direction of the primary trend. Currently for Gold the primary trend is up.
The daily Gold Futures Continuous Contract (GC1!) courtesy of Trading View illustrates the presumed forming Horizontal Triangle.
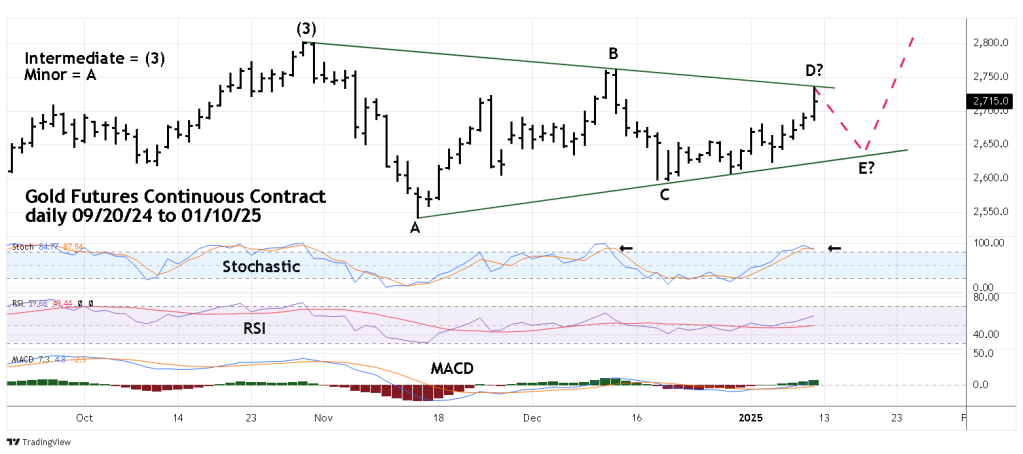
Typically, within a Horizontal Triangle there are Fibonacci relationships between the alternating waves. In this case the presumed Minor wave “C” is close to a Fibonacci .618 relationship to Minor wave “A”. Also, the Minor wave “D” rally is close to .618 the size of the Minor wave “B” rally.
The weak point of the Horizontal Triangle theory is the shape of the presumed Minor wave “A” Prior blogs on this website have noted that the late October 2024 to November 14 decline appears to be an Elliott – five wave Impulse pattern. Each of Horizontal Triangles sub waves divide into three waves not five. If the presumed wave “A” is a five-wave construction then another pattern is forming.
From the momentum perspective daily Stochastic has a bearish lines cross implying at least a short-term decline. Daily RSI and MACD are still trending higher implying the larger trend is up.
The next daily Gold chart shows two alternate Elliott wave counts.

It’s possible the Horizontal Triangle is already complete either at the 12/30/24 or the 01/06/25 bottoms.
A move above the 12/12/24 wave “B” top implies a post triangle thrust up is underway and Gold could soon be making new all-time highs.
A move below the 12/19/24 bottom could open the door for at least a test of the 11/14/24 bottom.
