The 01/02/25 blog “Probable Short-Term Rise for U.S. Stocks – 01/02/25” noted “Near – term the bulls appear poised for a rebound”.
The subsequent rally only lasted two trading days, and on 01/10/25 the rise was completely retraced. Is the new low the start of a major move down?
Momentum evidence reveals some interesting clues, but first a look at the intraday S&P 500 (SPX) Elliott wave count. The 60 Minute SPX chart is courtesy of Trading View.
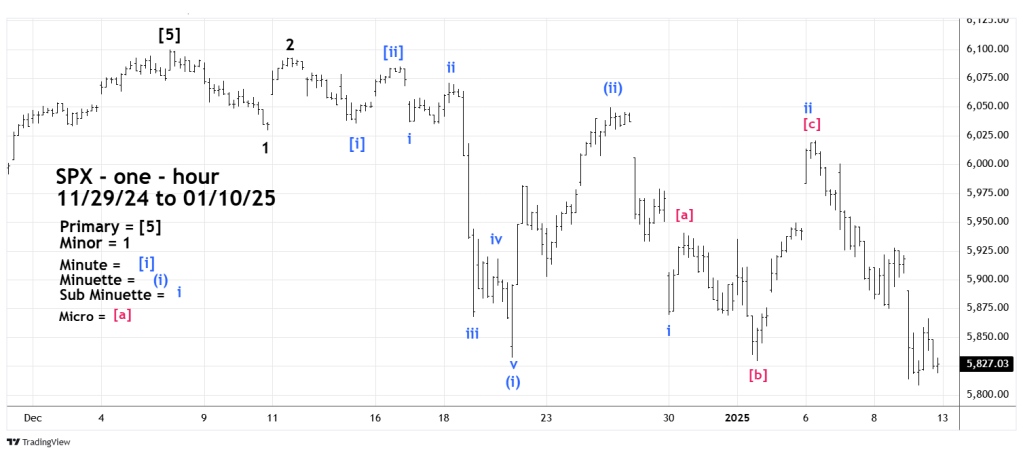
The chart illustrates one of four alternate Elliott wave counts of the SPX action since its all-time high. This count shows the SPX developing a series of “one’s” and “two’s” to the downside. If correct, the SPX could be on the verge of a very steep decline. However, its rare to have a series of three “one’s” and “two’s” which increases the chance that something else is developing.
The clues of something else are revealed by an examination of momentum evidence..
The daily SPX chart looks at external momentum.

One line of daily Stochastic has reached the oversold zone which starts at 20.00. This hints a short – term bottom could be nearby.
The RSI message is more bullish, it has a bullish divergence vs. the 12/20/24 reading.
MACD – Histogram has a bullish divergence.
The NYSE – 52 – week lows ($MALN) chart courtesy of Barchart.com illustrates internal momentum.
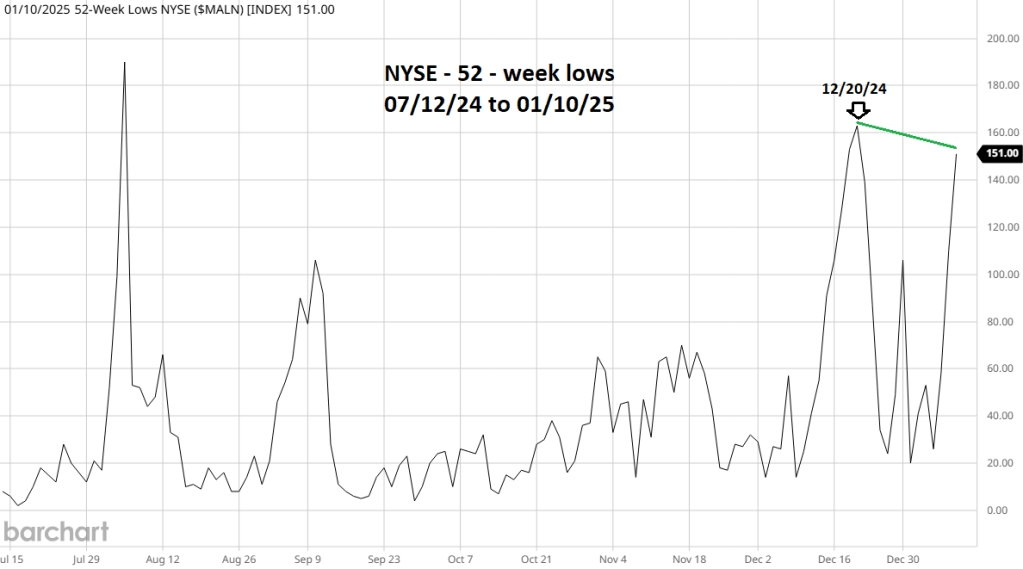
This chart also shows a bullish divergence vs. the 12/20/24 reading.
External and internal momentum for U.S. stocks implies another short-term bottom is in place or could soon be in place.
If on 01/13/25 the SPX declines more than 1.50% from its session close of 01/10/25 , it could be just the start of a very steep decline.
Otherwise, be prepared for another U.S. stock market rally.
