In November 2021 Tesla Inc. (TSLA) made a major top then underperformed the S&P 500 (SPX) for nearly three years. Then in the last quarter of 2024 -TSLA roared back to life, outperforming the SPX and made a new all-time high.
In the coming days TSLA could be an important indicator for the U.S. stock market.
The weekly TSLA chart courtesy of Trading View illustrates its action since 2021.
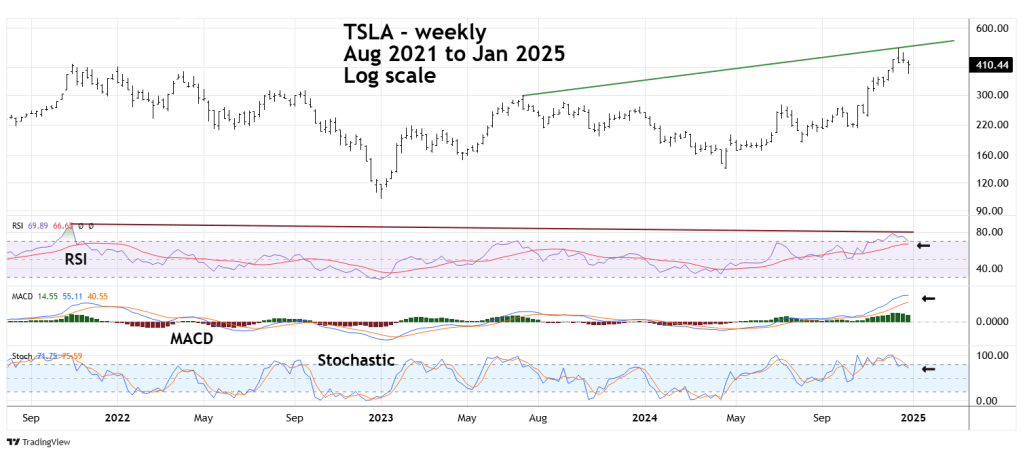
The weekly momentum picture is mixed. RSI has a long – term single bearish divergence yet has still not crossed below its weekly moving average. Also, it’s common for powerfully bullish stocks to have double bearish RSI divergences before making their ultimate peak.
MACD has no bearish lines cross, and Histogram has only a slight decline.
Stochastic has a bearish lines cross and both lines have entered the neutral zone.
The rising trendline connecting July 2023 and December 2024 peaks could prove to be future resistance.
The daily TSLA chart zooms in on more recent activity.
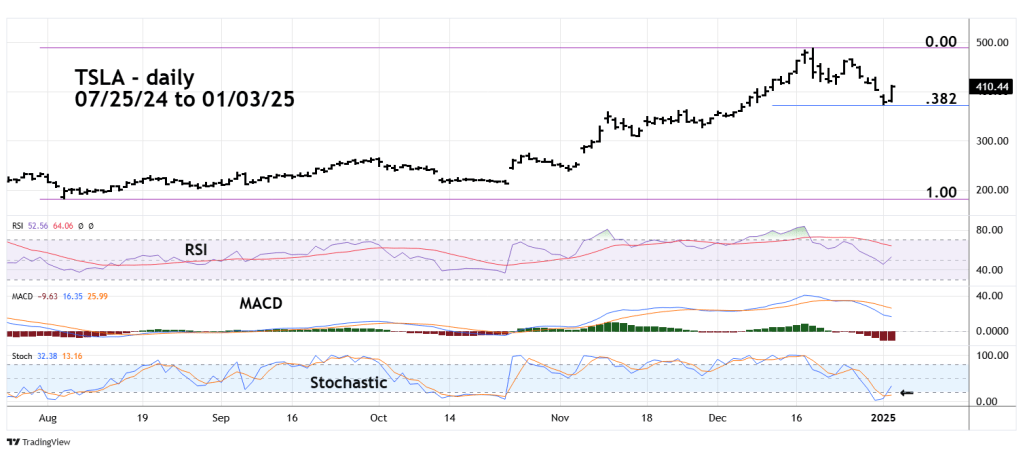
RSI has crossed below its daily moving average, however, note that the TSLA price peak corresponded with a maximum high RSI reading. The vast majority of the time stocks make significant peaks with at least one RSI bearish divergence.
MACD lines are trending down with plenty of room to go lower.
The most significant daily momentum signal comes from Stochastic. Note both lines reach the oversold zone below 20.00 and have bullish lines cross.
The most important message comes from price. The 01/02/25 bottom came right at a Fibonacci .382 retracement of the 08/05/24 to 12/18/24 rally. Also note the 12/18/24 to 01/02/25 decline was an Elliott wave – Single Zigzag correction.
Evidence from the dimensions of momentum and price suggests TSLA could rally to a new all-time high in the coming days.
If this occurs and the SPX fails to make a new all-time high it could be a very bearish clue for the broader U.S. stock market.
Watch Tesla Inc.
