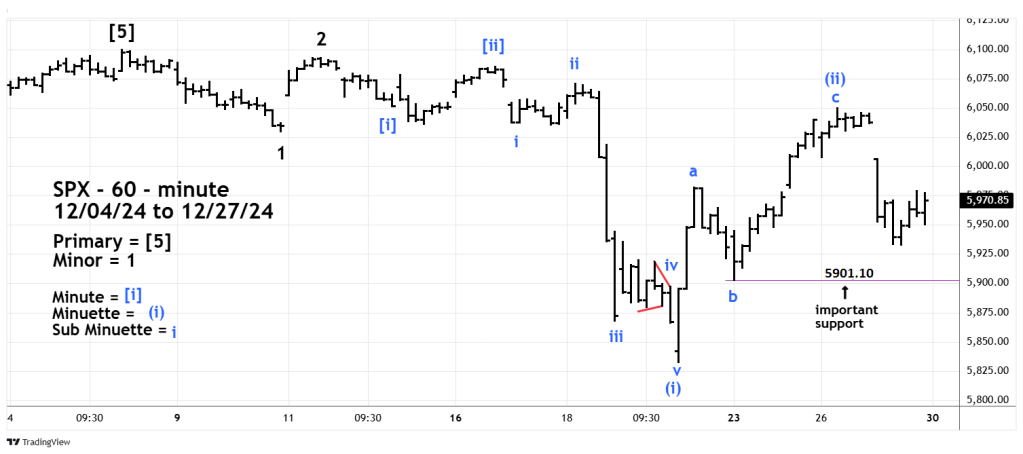
This websites prior blog illustrated that the S&P 500 (SPX) had reached Fibonacci and overhead resistance and noted. “The wave “c” of a presumed Elliott Wave – Single Zigzag may have terminated on 12/26/24”.
The 60-minute SPX chart courtesy of Trading View shows what happened.
All three of the main U.S stock indices had significant declines. The breath of the drop was widespread, the NYSE had only 16% of its stocks advance. Nasdaq had 25% of its stocks advance.
The prior blog also noted. “ A break below the presumed Sub Minuette wave “b” at 5,901.10 could open the door for a move down to the 12/20/24 bottom”.
Frequently there are fake break outs of support/resistance in which only marginal lows/highs are made.
The 60-minute S&P 500 – E-Mini Continuous Futures (ES1!) chart illustrates why a break below SPX 5,901 could be very bearish.
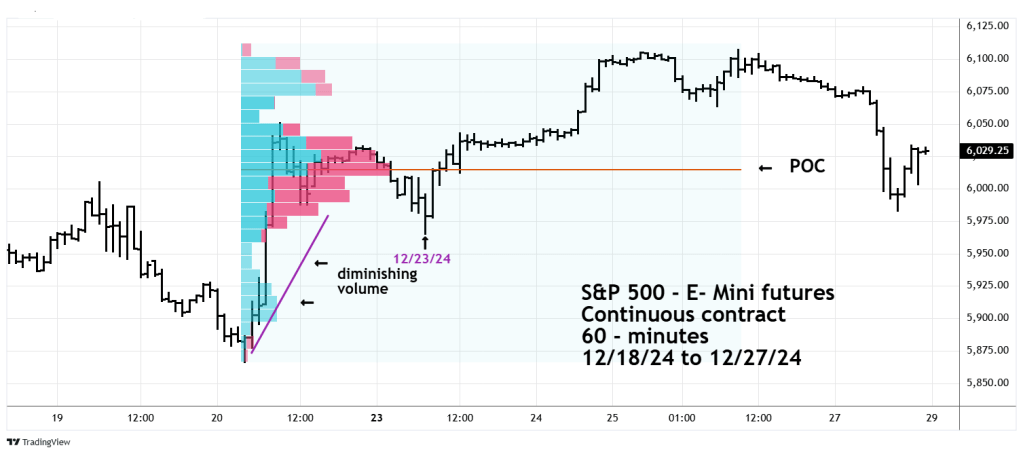
The Volume Profile method places volume on a vertical axis which allows volume to match price levels. The strength of potential support/resistance is measured by the wideness of the bars. The widest bar is called “Point of Control” (POC), this is where the strongest support/resistance can be found.
On 12/27/24 there was a decisive break below POC and the secondary support just below. Note that below the 12/27/24 price bottom, volume diminishes. Think in terms of battlefields, there are only a small number of bullish troops to defend price levels below the 12/27/24 bottom.
What happened to U.S. stocks on 12/27/24 could be just the first part of a much larger decline coming in January 2025.
