An examination of 52 -week lows for U.S. stocks reveals a developing bear market.
Looking just at the action of the main U.S. stock indices, the recent decline is minor. Viewing the new – 52 – week lows shows many U.S. stock are already in a bear market.
The daily S&P (SPX) 500 chart courtesy of Trading View illustrates some amazing data.
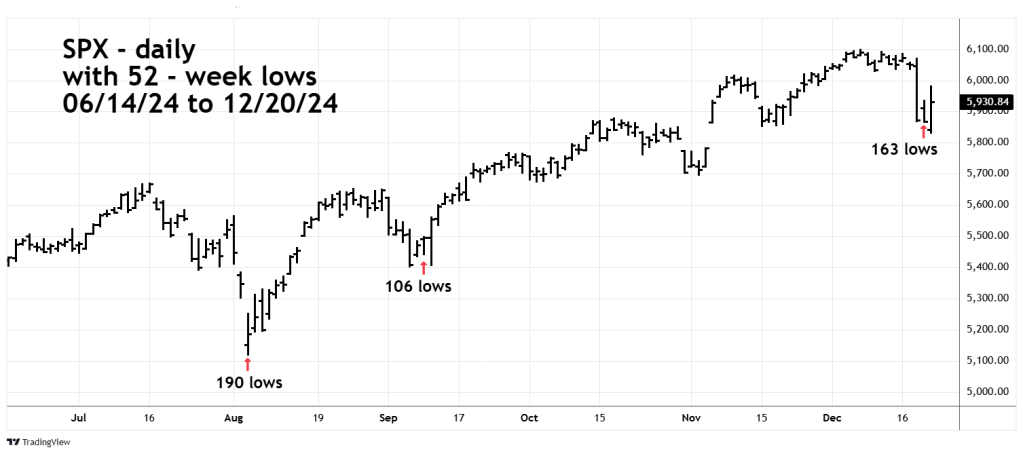
The maximum NYSE new – 52 – week lows was 190 made at the 08/05/24 mini crash bottom. Subsequently the SPX rallied, and on the next decline in September new – 52 – week lows fell to 106.
However, during the December SPX drop new 52 – week highs have reached 163 far above their September reading! A case could be made that the SPX should soon be trading at its mid – September level around 5,400.
The daily NYSE – 52-week lows ($MALN) chart courtesy of Barchart.com shows the action of NYSE lows since the beginning of 2024.
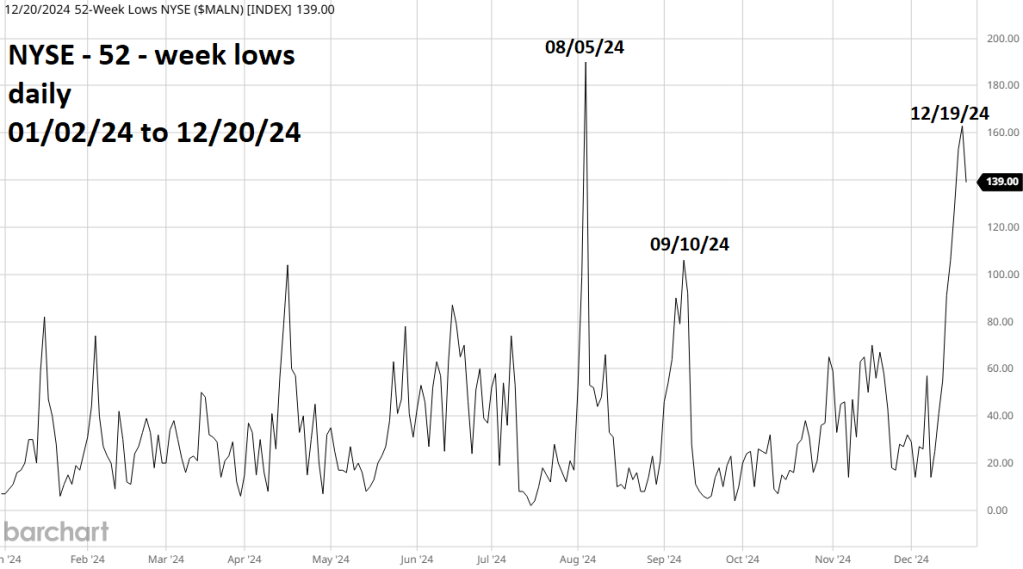
The recent spike up to 163 is the second highest of the year. If the downtrend continues the new 52 -week lows could soon exceed the 08/05/24 reading.
The daily Nasdaq Composite (IXIC) chart examines its rally progress since August 5th .
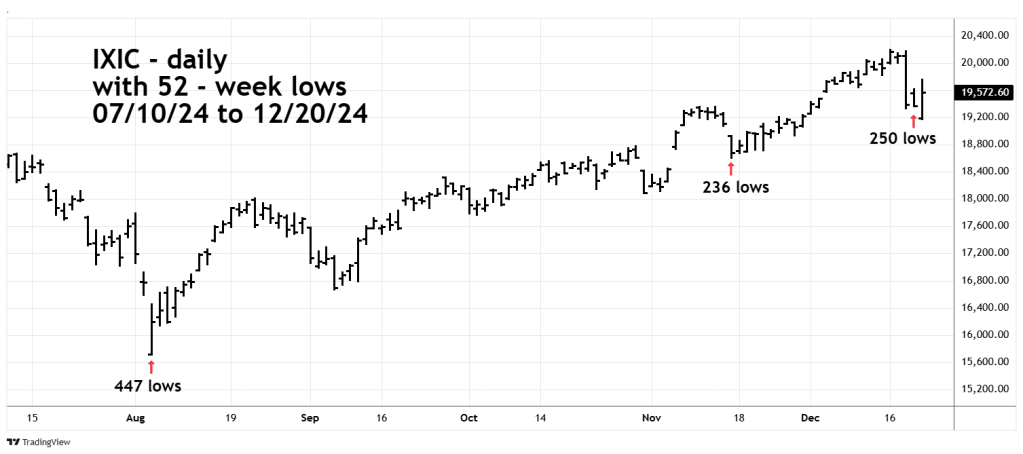
Maximum Nasdaq lows occurred at the 08/05/24 mini crash bottom. A lesser number of new lows 236 occurred on 11/15/24. The recent December decline saw an increase of new lows to 250.
The daily Nasdaq – 52 – week lows ($MALQ) chart illustrates the progress of new lows throughout 2024.
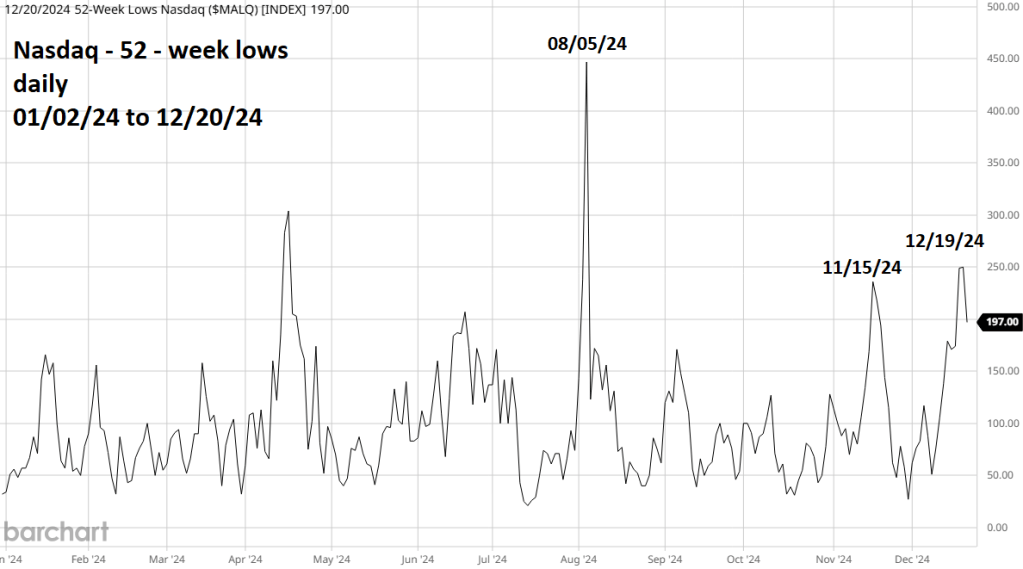
Nasdaq new lows are not as bearish as the NYSE new lows. Of the three main U.S. stock indices IXIC has the best chance of making a new high.
Its possible that the current new low readings indicate the broader U.S. stock market is oversold and ready for a new multi -week rally.
There are two factors we need to focus on during the next two weeks, Elliott wave price structure and time.
This websites prior blog examined the SPX – Elliott wave patterns and noted a potential rally top could occur in the range of 5,980 to 6,020. If the SPX rallies significantly above 6,020 it could open the door for a move to new all-time highs.
The time factor could be important very late in 2024 and very early 2025. Sometimes significant price trends begin on the cusp of a new year.
Because of the holidays, trading of U.S. stocks during the last two weeks of the year is usually slow and boring. Even if this happens, very important clues could develop.
Stay focused on U.S. stocks!
